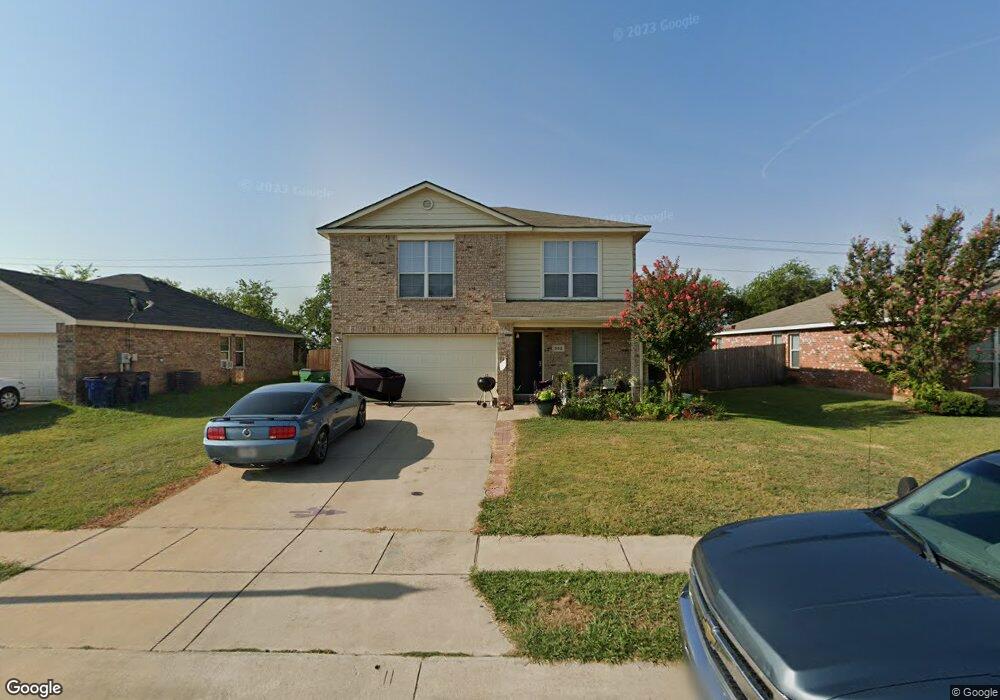
302 Deer Run Dr Sanger, TX 76266
Estimated Value: $265,251 - $280,000
3
Beds
3
Baths
1,407
Sq Ft
$194/Sq Ft
Est. Value
About This Home
This home is located at 302 Deer Run Dr, Sanger, TX 76266 and is currently estimated at $272,313, approximately $193 per square foot. 302 Deer Run Dr is a home located in Denton County with nearby schools including Chisholm Trail Elementary School, Clear Creek Intermediate School, and Sanger Sixth Grade Campus.
Ownership History
Date
Name
Owned For
Owner Type
Purchase Details
Closed on
May 8, 2025
Sold by
Volkman Douglas Randall and Volkman Lori L
Bought by
Trinity Key Holdings Llc
Current Estimated Value
Purchase Details
Closed on
May 25, 2022
Sold by
Walker Jason Michael and Walker Brooke
Bought by
Westoplex Renewal Co Llc
Purchase Details
Closed on
Jun 11, 2013
Sold by
Walker Amber Michelle
Bought by
Walker Jason Michael
Purchase Details
Closed on
Aug 31, 2004
Sold by
D R Horton Texas Lp
Bought by
Walker Jason and Walker Amber
Home Financials for this Owner
Home Financials are based on the most recent Mortgage that was taken out on this home.
Original Mortgage
$110,736
Interest Rate
6.08%
Mortgage Type
FHA
Create a Home Valuation Report for This Property
The Home Valuation Report is an in-depth analysis detailing your home's value as well as a comparison with similar homes in the area
Home Values in the Area
Average Home Value in this Area
Purchase History
| Date | Buyer | Sale Price | Title Company |
|---|---|---|---|
| Trinity Key Holdings Llc | -- | None Listed On Document | |
| Westoplex Renewal Co Llc | -- | None Listed On Document | |
| Walker Jason Michael | -- | None Available | |
| Walker Jason | -- | Dhi Title |
Source: Public Records
Mortgage History
| Date | Status | Borrower | Loan Amount |
|---|---|---|---|
| Previous Owner | Walker Jason | $110,736 |
Source: Public Records
Tax History Compared to Growth
Tax History
| Year | Tax Paid | Tax Assessment Tax Assessment Total Assessment is a certain percentage of the fair market value that is determined by local assessors to be the total taxable value of land and additions on the property. | Land | Improvement |
|---|---|---|---|---|
| 2025 | $5,546 | $274,504 | $71,407 | $203,097 |
| 2024 | $5,546 | $274,432 | $71,407 | $203,025 |
| 2023 | $5,492 | $271,013 | $58,424 | $212,589 |
| 2022 | $4,551 | $205,237 | $58,424 | $154,798 |
| 2021 | $3,921 | $186,579 | $47,063 | $139,516 |
| 2020 | $3,812 | $172,277 | $39,663 | $132,614 |
| 2019 | $3,643 | $160,000 | $39,663 | $120,337 |
| 2018 | $3,721 | $162,552 | $39,663 | $122,889 |
| 2017 | $3,480 | $151,311 | $39,663 | $111,648 |
| 2016 | $3,463 | $144,020 | $39,663 | $104,357 |
| 2015 | $2,608 | $119,976 | $26,396 | $93,580 |
| 2013 | -- | $102,611 | $26,396 | $77,505 |
Source: Public Records
Map
Nearby Homes
- 319 Quail Crossing Dr
- 321 Quail Crossing Dr
- 117 Teal Rd
- 114 Pintail Ln
- 130 Southside Dr
- 124 Morning Glory
- 202 Southland Dr
- 2004 S Stemmons St
- 226 Hillcrest St
- 2000 S Stemmons St
- 108 Magnolia Dr
- 209 Southland Dr
- 942 First St
- 936 First St
- 212 Diane Dr
- 185 Aster Dr
- 0000 Rector Rd
- 113 Diane Dr
- 109 Colonial Heights
- 505 Houston St
- 300 Deer Run Dr
- 304 Deer Run Dr
- 208 Deer Run Dr
- 306 Deer Run Dr
- 303 Deer Run Dr
- 206 Deer Run Dr
- 308 Deer Run Dr
- 301 Deer Run Dr
- 305 Deer Run Dr
- 307 Deer Run Dr
- 204 Deer Run Dr
- 310 Deer Run Dr
- 1410 Mandarin Dr
- 1408 Mandarin Dr
- 202 Deer Run Dr
- 311 Deer Run Dr
- 312 Deer Run Dr
- 302 Quail Crossing Dr
- 300 Quail Crossing Dr
- 304 Quail Crossing Dr