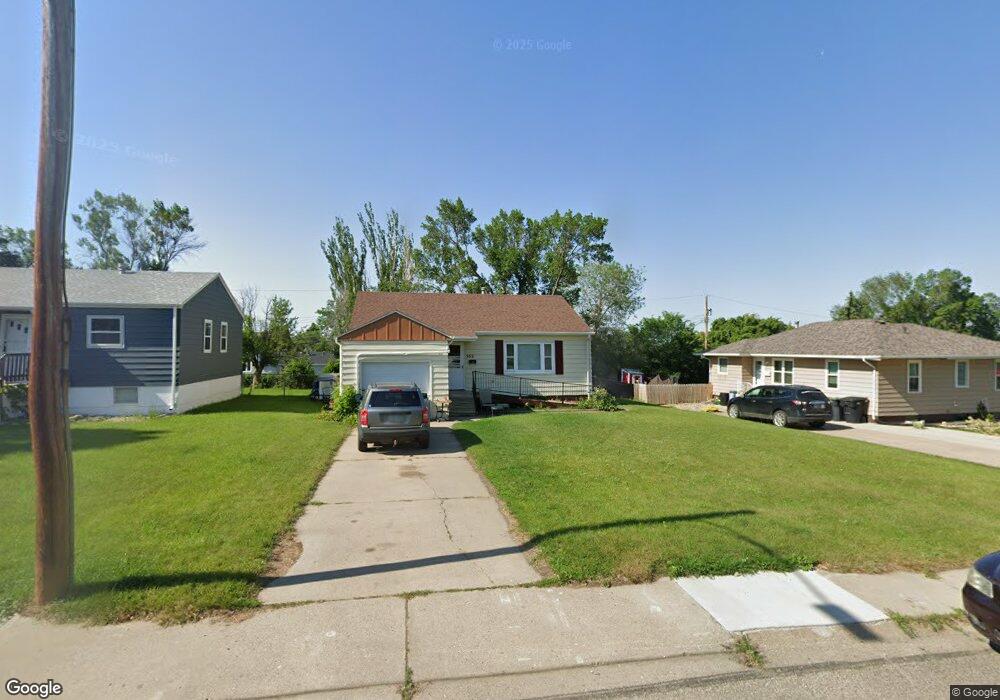
302 Division St NW Mandan, ND 58554
Estimated Value: $215,954 - $239,000
2
Beds
2
Baths
1,732
Sq Ft
$129/Sq Ft
Est. Value
About This Home
This home is located at 302 Division St NW, Mandan, ND 58554 and is currently estimated at $223,489, approximately $129 per square foot. 302 Division St NW is a home located in Morton County with nearby schools including Lewis & Clark Elementary School, Mandan Middle School, and Mandan High School.
Ownership History
Date
Name
Owned For
Owner Type
Purchase Details
Closed on
Jan 29, 2013
Sold by
Jorgensen Wanda O
Bought by
Jorgensen Tammy L
Current Estimated Value
Home Financials for this Owner
Home Financials are based on the most recent Mortgage that was taken out on this home.
Original Mortgage
$121,082
Outstanding Balance
$85,961
Interest Rate
3.75%
Mortgage Type
FHA
Estimated Equity
$137,528
Purchase Details
Closed on
Sep 5, 2006
Sold by
Thompson Chaye D and Thompson Chaye
Bought by
Jorgensen Tammy L and Jorgensen Wanda O
Home Financials for this Owner
Home Financials are based on the most recent Mortgage that was taken out on this home.
Original Mortgage
$19,080
Interest Rate
6.59%
Mortgage Type
Stand Alone Second
Purchase Details
Closed on
Feb 16, 2006
Sold by
Parker Vera M
Bought by
Thompson Chaye D
Home Financials for this Owner
Home Financials are based on the most recent Mortgage that was taken out on this home.
Original Mortgage
$85,260
Interest Rate
6.2%
Mortgage Type
New Conventional
Create a Home Valuation Report for This Property
The Home Valuation Report is an in-depth analysis detailing your home's value as well as a comparison with similar homes in the area
Home Values in the Area
Average Home Value in this Area
Purchase History
| Date | Buyer | Sale Price | Title Company |
|---|---|---|---|
| Jorgensen Tammy L | -- | North Dakota Guaranty & Titl | |
| Jorgensen Tammy L | $95,400 | Mandan Title Company | |
| Thompson Chaye D | -- | Mandan Title Company |
Source: Public Records
Mortgage History
| Date | Status | Borrower | Loan Amount |
|---|---|---|---|
| Open | Jorgensen Tammy L | $121,082 | |
| Closed | Jorgensen Tammy L | $19,080 | |
| Closed | Jorgensen Tammy L | $76,320 | |
| Previous Owner | Thompson Chaye D | $85,260 |
Source: Public Records
Tax History Compared to Growth
Tax History
| Year | Tax Paid | Tax Assessment Tax Assessment Total Assessment is a certain percentage of the fair market value that is determined by local assessors to be the total taxable value of land and additions on the property. | Land | Improvement |
|---|---|---|---|---|
| 2024 | $2,601 | $84,750 | $0 | $0 |
| 2023 | $2,035 | $78,450 | $0 | $0 |
| 2022 | $2,011 | $73,600 | $0 | $0 |
| 2021 | $1,891 | $67,200 | $0 | $0 |
| 2020 | $1,848 | $104,100 | $0 | $0 |
| 2019 | $1,831 | $64,500 | $0 | $0 |
| 2018 | $1,746 | $64,500 | $15,000 | $49,500 |
| 2017 | $1,898 | $63,800 | $15,000 | $48,800 |
| 2016 | $1,792 | $63,400 | $15,000 | $48,400 |
| 2015 | $1,697 | $61,350 | $10,000 | $51,350 |
| 2014 | $1,961 | $59,550 | $6,900 | $52,650 |
| 2013 | $1,802 | $57,450 | $6,350 | $51,100 |
Source: Public Records
Map
Nearby Homes
- 1200 2nd Ave NW
- 809 2nd Ave NW
- 104 12th St NW
- 606 Collins Ave
- 501 7th St NW
- 3011 8th Ave NW
- 104 6th St NE
- 1305 Monte Dr
- 222 14th St NE Unit 4
- 1405 6th Ave NW
- 604 5th Ave NW
- 705 8th Ave NW
- 609 3rd Ave NE
- 508 1st Ave NE
- 1500 3rd Ave NE
- 312 15th St NE
- 1504 3rd Ave NE
- 507 2nd Ave NE
- 507 6th Ave NW
- 1503 Sunset Dr
- 304 Division St NW
- 1101 2nd Ave NW
- 306 Division St NW
- 307 Division St NW
- 305 Division St NW
- 308 Division St NW
- 1003 2nd Ave NW
- 1103 2nd Ave NW
- 307 11th St NW
- 1006 3rd Ave NW
- 310 Division St NW
- 1100 2nd Ave NW
- 304 9th St NW
- 306 9th St NW
- 1001 2nd Ave NW
- 311 11th St NW
- 1102 2nd Ave NW
- 1002 3rd Ave NW
- 312 Division St NW
- 208 Division St NW