Estimated Value: $62,000 - $130,000
--
Bed
3
Baths
1,076
Sq Ft
$78/Sq Ft
Est. Value
About This Home
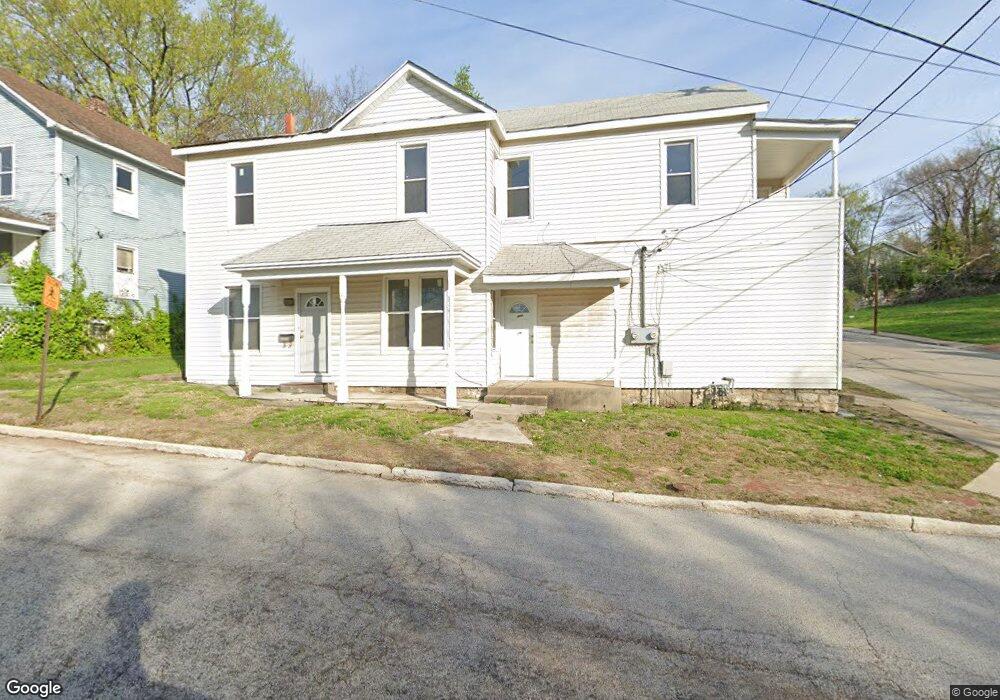
This home is located at 302 Dry St, Alton, IL 62002 and is currently estimated at $83,477, approximately $77 per square foot. 302 Dry St is a home located in Madison County with nearby schools including West Elementary School, Alton Middle School, and Alton High School.
Ownership History
Date
Name
Owned For
Owner Type
Purchase Details
Closed on
Jun 8, 2006
Sold by
Pike John S and Battis Lawrence J
Bought by
Henson Ty and Burraughs Mike
Current Estimated Value
Purchase Details
Closed on
Apr 1, 2004
Sold by
Hawkins Monty and Hawkins Julie
Bought by
Pike John S and Battis Lawrence J
Home Financials for this Owner
Home Financials are based on the most recent Mortgage that was taken out on this home.
Original Mortgage
$23,120
Interest Rate
5.65%
Mortgage Type
Purchase Money Mortgage
Create a Home Valuation Report for This Property
The Home Valuation Report is an in-depth analysis detailing your home's value as well as a comparison with similar homes in the area
Home Values in the Area
Average Home Value in this Area
Purchase History
| Date | Buyer | Sale Price | Title Company |
|---|---|---|---|
| Henson Ty | $34,000 | Premier Title & Escrow Co | |
| Pike John S | $29,000 | Chicago Title |
Source: Public Records
Mortgage History
| Date | Status | Borrower | Loan Amount |
|---|---|---|---|
| Previous Owner | Pike John S | $23,120 |
Source: Public Records
Tax History Compared to Growth
Tax History
| Year | Tax Paid | Tax Assessment Tax Assessment Total Assessment is a certain percentage of the fair market value that is determined by local assessors to be the total taxable value of land and additions on the property. | Land | Improvement |
|---|---|---|---|---|
| 2024 | $1,304 | $16,040 | $1,840 | $14,200 |
| 2023 | $1,304 | $14,480 | $1,660 | $12,820 |
| 2022 | $1,225 | $13,090 | $1,500 | $11,590 |
| 2021 | $1,127 | $12,300 | $1,410 | $10,890 |
| 2020 | $1,101 | $11,860 | $1,360 | $10,500 |
| 2019 | $1,138 | $11,590 | $1,330 | $10,260 |
| 2018 | $1,108 | $11,290 | $1,300 | $9,990 |
| 2017 | $1,091 | $11,280 | $1,290 | $9,990 |
| 2016 | $1,070 | $11,280 | $1,290 | $9,990 |
| 2015 | $1,017 | $11,280 | $1,290 | $9,990 |
| 2014 | $1,017 | $11,280 | $1,290 | $9,990 |
| 2013 | $1,017 | $11,590 | $1,330 | $10,260 |
Source: Public Records
Map
Nearby Homes