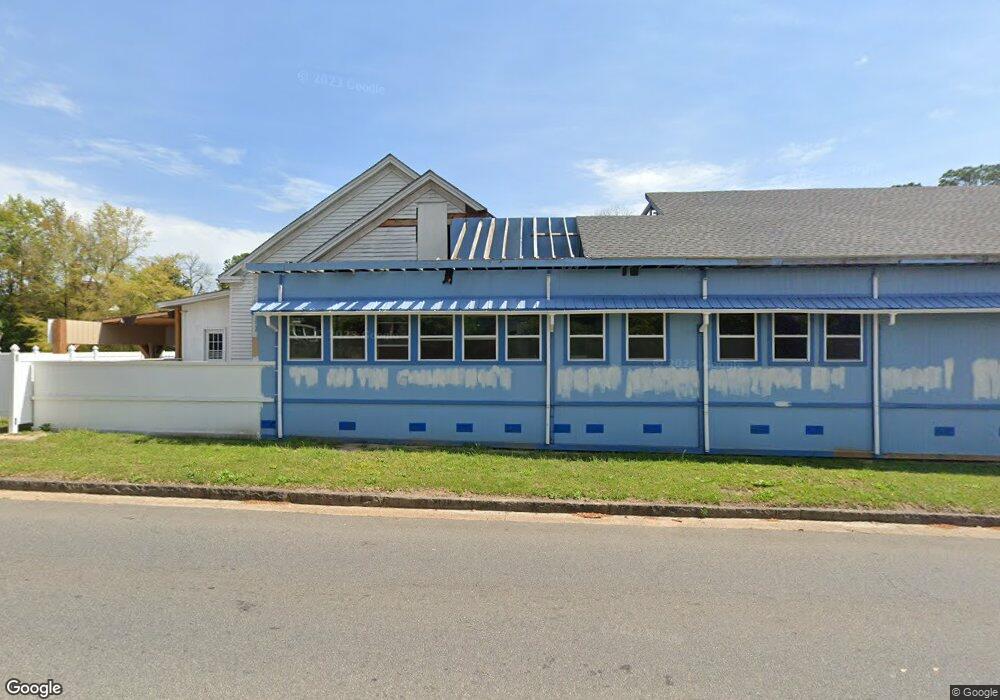
302 E 14th Ave Cordele, GA 31015
Estimated Value: $90,000 - $119,000
3
Beds
2
Baths
6,074
Sq Ft
$17/Sq Ft
Est. Value
About This Home
This home is located at 302 E 14th Ave, Cordele, GA 31015 and is currently estimated at $104,703, approximately $17 per square foot. 302 E 14th Ave is a home located in Crisp County with nearby schools including Crisp County Elementary School, Crisp County Primary School, and Crisp County Middle School.
Ownership History
Date
Name
Owned For
Owner Type
Purchase Details
Closed on
Jun 29, 2021
Sold by
Sinnott Stephanie Nicole
Bought by
Sinnott Stephanie Nicole and Sinnott Amber
Current Estimated Value
Purchase Details
Closed on
Sep 28, 2017
Bought by
Sinnott Stephanie
Purchase Details
Closed on
Nov 2, 2010
Sold by
Roth Kristiansson
Bought by
Art Works Llc
Purchase Details
Closed on
Nov 15, 2006
Sold by
Spires Denise Tate
Bought by
Kristiansson Roth Pc
Purchase Details
Closed on
Feb 8, 2005
Sold by
Spires Danny
Bought by
Spires Wesley D and Spires Denise Tate
Home Financials for this Owner
Home Financials are based on the most recent Mortgage that was taken out on this home.
Original Mortgage
$13,412
Interest Rate
5.68%
Mortgage Type
New Conventional
Purchase Details
Closed on
Jul 20, 1999
Sold by
Culpepper P Melton
Bought by
Spires Danny
Purchase Details
Closed on
Mar 6, 1975
Bought by
Culpepper P Melton
Create a Home Valuation Report for This Property
The Home Valuation Report is an in-depth analysis detailing your home's value as well as a comparison with similar homes in the area
Purchase History
| Date | Buyer | Sale Price | Title Company |
|---|---|---|---|
| Sinnott Stephanie Nicole | -- | -- | |
| Sinnott Stephanie | $50,000 | -- | |
| Art Works Llc | -- | -- | |
| Kristiansson Roth Pc | $45,000 | -- | |
| Spires Wesley D | -- | -- | |
| Spires Danny | $40,000 | -- | |
| Culpepper P Melton | -- | -- |
Source: Public Records
Mortgage History
| Date | Status | Borrower | Loan Amount |
|---|---|---|---|
| Previous Owner | Spires Wesley D | $13,412 |
Source: Public Records
Tax History
| Year | Tax Paid | Tax Assessment Tax Assessment Total Assessment is a certain percentage of the fair market value that is determined by local assessors to be the total taxable value of land and additions on the property. | Land | Improvement |
|---|---|---|---|---|
| 2025 | $1,201 | $40,000 | $2,250 | $37,750 |
| 2024 | $1,591 | $45,784 | $2,250 | $43,534 |
| 2023 | $1,006 | $28,233 | $2,250 | $25,983 |
| 2022 | $660 | $26,973 | $2,250 | $24,723 |
| 2021 | $647 | $25,291 | $2,250 | $23,041 |
| 2020 | $656 | $25,291 | $2,250 | $23,041 |
| 2019 | $717 | $25,291 | $2,250 | $23,041 |
| 2018 | $590 | $25,820 | $2,250 | $23,570 |
| 2017 | $1,048 | $25,820 | $2,250 | $23,570 |
| 2016 | $764 | $25,820 | $2,250 | $23,570 |
| 2015 | -- | $25,820 | $2,250 | $23,570 |
| 2014 | -- | $25,820 | $2,250 | $23,570 |
| 2013 | -- | $25,820 | $2,250 | $23,570 |
Source: Public Records
Map
Nearby Homes
Your Personal Tour Guide
Ask me questions while you tour the home.