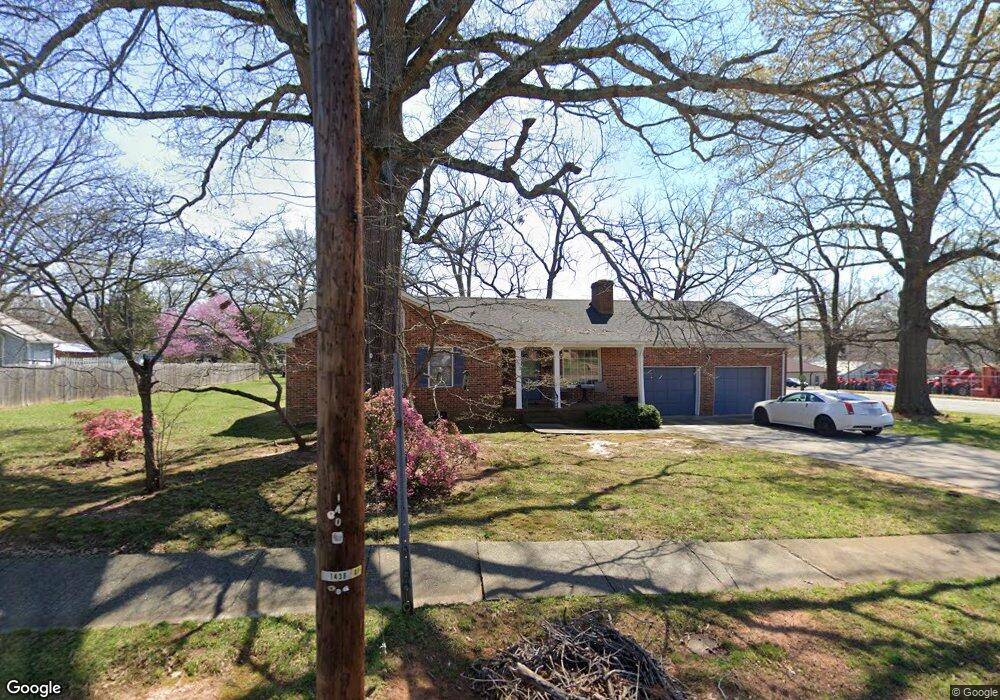
302 E 2nd St Siler City, NC 27344
Estimated Value: $232,000 - $319,000
3
Beds
2
Baths
1,668
Sq Ft
$159/Sq Ft
Est. Value
About This Home
This home is located at 302 E 2nd St, Siler City, NC 27344 and is currently estimated at $264,751, approximately $158 per square foot. 302 E 2nd St is a home located in Chatham County with nearby schools including Virginia Cross Elementary School, Chatham Middle, and Jordan Matthews High.
Ownership History
Date
Name
Owned For
Owner Type
Purchase Details
Closed on
Jan 7, 2019
Sold by
Mcmasters Linda Maness and Mcmasters Geroge D
Bought by
Douglass Alston Lois E
Current Estimated Value
Home Financials for this Owner
Home Financials are based on the most recent Mortgage that was taken out on this home.
Original Mortgage
$8,000
Outstanding Balance
$7,048
Interest Rate
4.8%
Mortgage Type
Unknown
Estimated Equity
$257,703
Purchase Details
Closed on
Jan 23, 2013
Sold by
Marblo Mcmaster Grant Daniel and Marblo Mcmasters Alicia
Bought by
Mcmasters Linda Maness
Home Financials for this Owner
Home Financials are based on the most recent Mortgage that was taken out on this home.
Original Mortgage
$80,000
Interest Rate
3.38%
Mortgage Type
Future Advance Clause Open End Mortgage
Create a Home Valuation Report for This Property
The Home Valuation Report is an in-depth analysis detailing your home's value as well as a comparison with similar homes in the area
Purchase History
| Date | Buyer | Sale Price | Title Company |
|---|---|---|---|
| Douglass Alston Lois E | $172,000 | None Available | |
| Mcmasters Linda Maness | $100,000 | None Available |
Source: Public Records
Mortgage History
| Date | Status | Borrower | Loan Amount |
|---|---|---|---|
| Open | Douglass Alston Lois E | $8,000 | |
| Previous Owner | Mcmasters Linda Maness | $80,000 |
Source: Public Records
Tax History
| Year | Tax Paid | Tax Assessment Tax Assessment Total Assessment is a certain percentage of the fair market value that is determined by local assessors to be the total taxable value of land and additions on the property. | Land | Improvement |
|---|---|---|---|---|
| 2025 | $3,081 | $247,812 | $22,650 | $225,162 |
| 2024 | $3,081 | $173,650 | $18,875 | $154,775 |
| 2023 | $2,197 | $173,650 | $18,875 | $154,775 |
| 2022 | $2,092 | $173,650 | $18,875 | $154,775 |
| 2021 | $2,137 | $177,304 | $18,875 | $158,429 |
| 2020 | $1,937 | $160,108 | $18,450 | $141,658 |
| 2019 | $1,937 | $160,108 | $18,450 | $141,658 |
| 2018 | $1,822 | $160,108 | $18,450 | $141,658 |
| 2017 | $1,822 | $160,108 | $18,450 | $141,658 |
| 2016 | $1,731 | $155,413 | $20,500 | $134,913 |
| 2015 | $1,712 | $155,413 | $20,500 | $134,913 |
| 2014 | $1,712 | $155,413 | $20,500 | $134,913 |
| 2013 | -- | $155,413 | $20,500 | $134,913 |
Source: Public Records
Map
Nearby Homes
- 516 E 4th St
- TBD E 3rd St
- 411 W Raleigh St
- 303 W Dolphin St
- 519 W Raleigh St
- 726 S 2nd Ave
- 00 U S Highway 64
- 0 13th St
- 513 W Glendale St
- 430 W 9th St
- 1202 Red Sunset Place
- 1201 Red Sunset Place
- 901 Tanglewood Dr Extension
- N/A Driftwood Dr
- 0 W 3rd St
- Lot 00 John Snipes Rd
- 1009 Driftwood Dr
- 1501 Duet Dr
- 0 N Richardson Rd Unit 10153403
- 56 N Hillcrest Rd
- 308 E 2nd St
- 308 E 2nd St Unit A
- 308 E 2nd St Unit A
- 112 N Birch Ave Unit 2D
- 112 N Birch Ave Unit 2C
- 112 N Birch Ave Unit 2C
- 112 N Birch Ave Unit 2B
- 301 E Raleigh St
- 301 E 2nd St
- 314 E 2nd St
- 307 E 2nd St
- 307 E 2nd St Unit 2
- 307 Second St Unit 2
- 307 Second St
- 301 Second Ave
- 311 Second St
- 309 Second St Unit 3
- 309 Second St
- 309 E 2nd St
- 309 E 2nd St Unit 3
Your Personal Tour Guide
Ask me questions while you tour the home.