Estimated Value: $155,832 - $198,000
--
Bed
--
Bath
1,369
Sq Ft
$130/Sq Ft
Est. Value
About This Home
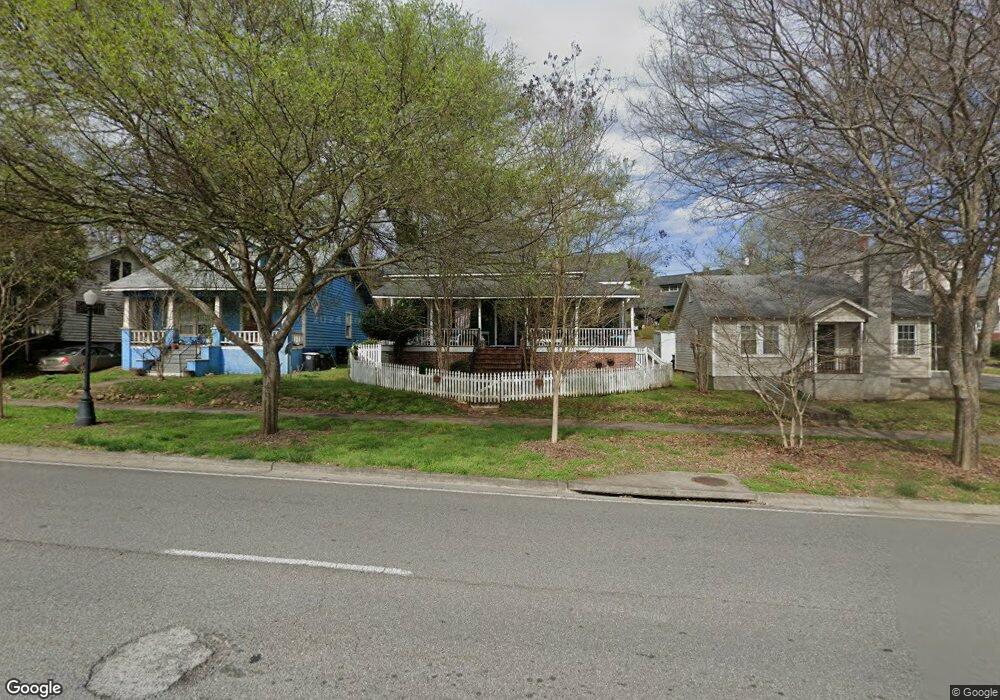
This home is located at 302 E 6th St SW, Rome, GA 30161 and is currently estimated at $177,458, approximately $129 per square foot. 302 E 6th St SW is a home located in Floyd County with nearby schools including Dan McCarty Middle School, Rome High School, and St. Mary School.
Ownership History
Date
Name
Owned For
Owner Type
Purchase Details
Closed on
Jul 20, 2001
Sold by
Fisher David J
Bought by
Lockley Millie
Current Estimated Value
Purchase Details
Closed on
Jan 26, 2000
Sold by
Davis Patrice M
Bought by
Fisher David J
Purchase Details
Closed on
Aug 15, 1995
Sold by
Pike Todd F
Bought by
Davis Patrice M
Purchase Details
Closed on
Jul 19, 1993
Sold by
Worley Charles H
Bought by
Pike Todd F
Purchase Details
Closed on
Jul 27, 1988
Sold by
Lewis Terry D and Lewis Nancy J
Bought by
Worley Charles H
Purchase Details
Closed on
Jun 25, 1985
Sold by
Worley Charles H
Bought by
Lewis Terry D and Lewis Nancy J
Purchase Details
Closed on
Mar 16, 1984
Sold by
Stegall Harold L
Bought by
Worley Charles H
Purchase Details
Closed on
Jul 10, 1980
Sold by
Anderson Judy P
Bought by
Stegall Harold L
Purchase Details
Closed on
May 3, 1973
Sold by
Harbour Raymond T
Bought by
Anderson Judy P
Purchase Details
Closed on
Oct 2, 1963
Sold by
Wakeley F J Mrs
Bought by
Harbour Raymond T
Purchase Details
Closed on
Jan 1, 1901
Bought by
Wakeley F J Mrs
Create a Home Valuation Report for This Property
The Home Valuation Report is an in-depth analysis detailing your home's value as well as a comparison with similar homes in the area
Home Values in the Area
Average Home Value in this Area
Purchase History
| Date | Buyer | Sale Price | Title Company |
|---|---|---|---|
| Lockley Millie | $56,000 | -- | |
| Fisher David J | $38,500 | -- | |
| Davis Patrice M | $39,900 | -- | |
| Pike Todd F | $18,500 | -- | |
| Worley Charles H | -- | -- | |
| Lewis Terry D | $152,300 | -- | |
| Worley Charles H | $20,000 | -- | |
| Stegall Harold L | $8,500 | -- | |
| Anderson Judy P | $10,500 | -- | |
| Harbour Raymond T | $3,500 | -- | |
| Wakeley F J Mrs | -- | -- |
Source: Public Records
Tax History Compared to Growth
Tax History
| Year | Tax Paid | Tax Assessment Tax Assessment Total Assessment is a certain percentage of the fair market value that is determined by local assessors to be the total taxable value of land and additions on the property. | Land | Improvement |
|---|---|---|---|---|
| 2024 | $1,283 | $55,674 | $5,040 | $50,634 |
| 2023 | $1,233 | $53,087 | $4,480 | $48,607 |
| 2022 | $1,128 | $44,802 | $3,640 | $41,162 |
| 2021 | $1,085 | $41,363 | $3,640 | $37,723 |
| 2020 | $1,050 | $39,038 | $2,800 | $36,238 |
| 2019 | $1,017 | $37,533 | $2,800 | $34,733 |
| 2018 | $988 | $35,882 | $2,800 | $33,082 |
| 2017 | $955 | $33,951 | $2,800 | $31,151 |
| 2016 | $949 | $33,530 | $2,800 | $30,730 |
| 2015 | $912 | $33,530 | $2,800 | $30,730 |
| 2014 | $912 | $33,530 | $2,800 | $30,730 |
Source: Public Records
Map
Nearby Homes
- 304 1/2 E 6th St SW
- 304 E 6th St SW
- E E 6th St
- 1 Coral Ave SW
- 3 Coral Ave SW
- 306 E 6th St SW
- 219 E 6th St SW
- 5 Coral Ave SW
- 604 River Ave SW
- 217 E 6th St SW
- 215 E 6th St SW
- 606 River Ave SW
- 308 E 6th St SW
- 700 River Ave SW
- 609 Maple Ave SW
- 212 E 6th St
- 608 River Ave SW
- 213 E 6th St SW
- 7 Coral Ave SW
- 310 E 6th St