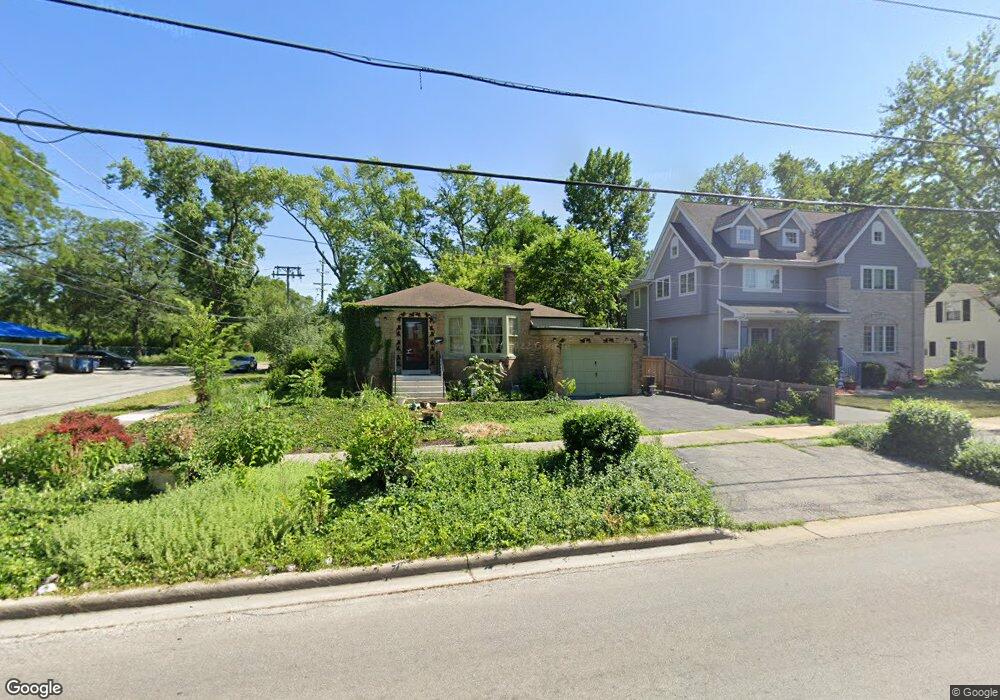
302 E Crescent Ave Elmhurst, IL 60126
Estimated Value: $430,000 - $530,000
2
Beds
1
Bath
1,125
Sq Ft
$431/Sq Ft
Est. Value
About This Home
This home is located at 302 E Crescent Ave, Elmhurst, IL 60126 and is currently estimated at $485,122, approximately $431 per square foot. 302 E Crescent Ave is a home located in DuPage County with nearby schools including Pulaski Intl School of Chicago, Jefferson Elementary School, and Sandburg Middle School.
Ownership History
Date
Name
Owned For
Owner Type
Purchase Details
Closed on
Apr 24, 2000
Sold by
Colonna Matteo N and Colonna Carla A
Bought by
Rickards Toni G
Current Estimated Value
Home Financials for this Owner
Home Financials are based on the most recent Mortgage that was taken out on this home.
Original Mortgage
$175,500
Outstanding Balance
$56,402
Interest Rate
7.37%
Estimated Equity
$428,720
Purchase Details
Closed on
Jul 22, 1998
Sold by
Brune Joseph C and Brune Mary A
Bought by
Colonna Matteo N and Colonna Carla A
Home Financials for this Owner
Home Financials are based on the most recent Mortgage that was taken out on this home.
Original Mortgage
$154,350
Interest Rate
7.13%
Mortgage Type
FHA
Purchase Details
Closed on
Jun 15, 1995
Sold by
Decourtney Lois J and The Lois J De Courtney Trust
Bought by
Brune Joseph C and Brune Mary A
Home Financials for this Owner
Home Financials are based on the most recent Mortgage that was taken out on this home.
Original Mortgage
$135,900
Interest Rate
7.9%
Create a Home Valuation Report for This Property
The Home Valuation Report is an in-depth analysis detailing your home's value as well as a comparison with similar homes in the area
Home Values in the Area
Average Home Value in this Area
Purchase History
| Date | Buyer | Sale Price | Title Company |
|---|---|---|---|
| Rickards Toni G | $195,000 | -- | |
| Colonna Matteo N | $166,000 | -- | |
| Brune Joseph C | $151,000 | -- |
Source: Public Records
Mortgage History
| Date | Status | Borrower | Loan Amount |
|---|---|---|---|
| Open | Rickards Toni G | $175,500 | |
| Previous Owner | Colonna Matteo N | $154,350 | |
| Previous Owner | Brune Joseph C | $135,900 |
Source: Public Records
Tax History Compared to Growth
Tax History
| Year | Tax Paid | Tax Assessment Tax Assessment Total Assessment is a certain percentage of the fair market value that is determined by local assessors to be the total taxable value of land and additions on the property. | Land | Improvement |
|---|---|---|---|---|
| 2024 | $7,490 | $140,290 | $98,645 | $41,645 |
| 2023 | $3,901 | $129,730 | $91,220 | $38,510 |
| 2022 | $4,199 | $124,700 | $87,690 | $37,010 |
| 2021 | $4,203 | $121,600 | $85,510 | $36,090 |
| 2020 | $4,135 | $118,940 | $83,640 | $35,300 |
| 2019 | $4,266 | $113,080 | $79,520 | $33,560 |
| 2018 | $4,290 | $115,550 | $75,270 | $40,280 |
| 2017 | $4,412 | $110,110 | $71,730 | $38,380 |
| 2016 | $4,597 | $103,730 | $67,570 | $36,160 |
| 2015 | $4,901 | $96,640 | $62,950 | $33,690 |
| 2014 | $5,337 | $80,250 | $49,970 | $30,280 |
| 2013 | $5,287 | $81,380 | $50,670 | $30,710 |
Source: Public Records
Map
Nearby Homes
- 274 E Crescent Ave
- 613 S Chatham Ave
- 562 S Poplar Ave
- 341 E Madison St
- 580 S Kearsage Ave
- 185 E Oneida Ave
- 550 S Hillcrest Ave
- 694 S York St
- 427 E Adams St
- 675 S Edgewood Ave
- 593 S Edgewood Ave
- 441 E Adams St
- 515 S Parkview Ave
- 494 E Atwood Ct
- 224 E May St
- 505 E Atwood Ct
- 497 S Stratford Ave
- 500 S Kenilworth Ave
- 900 S Colfax Ave
- 446 S Stratford Ave
- 652 S Poplar Ave
- 294 E Crescent Ave
- 303 E Crescent Ave
- 290 E Crescent Ave
- 626 S Poplar Ave
- 311 E Crescent Ave
- 286 E Crescent Ave
- 627 S Poplar Ave
- 629 S Colfax Ave
- 620 S Poplar Ave
- 625 S Colfax Ave
- 621 S Poplar Ave
- 282 E Crescent Ave
- 621 S Colfax Ave
- 289 E Cayuga Ave
- 614 S Poplar Ave
- 285 E Cayuga Ave
- 297 E Cayuga Ave
- 619 S Poplar Ave
- 293 E Cayuga Ave