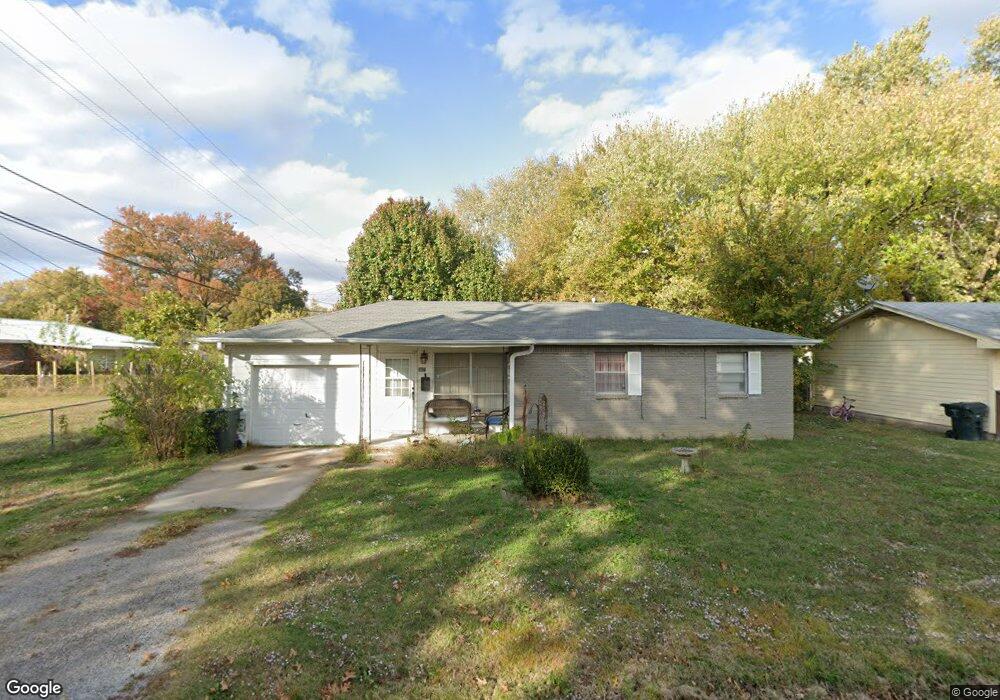
302 E Fry Place Claremore, OK 74017
Estimated Value: $130,580 - $163,000
3
Beds
1
Bath
1,024
Sq Ft
$140/Sq Ft
Est. Value
About This Home
This home is located at 302 E Fry Place, Claremore, OK 74017 and is currently estimated at $143,395, approximately $140 per square foot. 302 E Fry Place is a home located in Rogers County with nearby schools including Claremont Elementary School, Will Rogers Junior High School, and Claremore High School.
Ownership History
Date
Name
Owned For
Owner Type
Purchase Details
Closed on
Jul 29, 2021
Sold by
Walker Deborah Renee and Walker Leon Ray
Bought by
Nolan Rudi Dean
Current Estimated Value
Home Financials for this Owner
Home Financials are based on the most recent Mortgage that was taken out on this home.
Original Mortgage
$23,750
Outstanding Balance
$17,830
Interest Rate
2.3%
Mortgage Type
Purchase Money Mortgage
Estimated Equity
$125,565
Purchase Details
Closed on
Jul 22, 2015
Sold by
Nolan Rudi D and Nolan Ginger R
Bought by
Nolan Rudi D and Nolan Ginger R
Home Financials for this Owner
Home Financials are based on the most recent Mortgage that was taken out on this home.
Original Mortgage
$75,000
Interest Rate
4.08%
Mortgage Type
New Conventional
Purchase Details
Closed on
Apr 19, 2002
Sold by
Peterson Royce G
Create a Home Valuation Report for This Property
The Home Valuation Report is an in-depth analysis detailing your home's value as well as a comparison with similar homes in the area
Home Values in the Area
Average Home Value in this Area
Purchase History
| Date | Buyer | Sale Price | Title Company |
|---|---|---|---|
| Nolan Rudi Dean | $25,000 | Titan Title & Closing Llc | |
| Nolan Rudi D | -- | None Available | |
| -- | $69,000 | -- |
Source: Public Records
Mortgage History
| Date | Status | Borrower | Loan Amount |
|---|---|---|---|
| Open | Nolan Rudi Dean | $23,750 | |
| Previous Owner | Nolan Rudi D | $75,000 |
Source: Public Records
Tax History Compared to Growth
Tax History
| Year | Tax Paid | Tax Assessment Tax Assessment Total Assessment is a certain percentage of the fair market value that is determined by local assessors to be the total taxable value of land and additions on the property. | Land | Improvement |
|---|---|---|---|---|
| 2025 | $854 | $9,699 | $3,475 | $6,224 |
| 2024 | $854 | $9,237 | $2,520 | $6,717 |
| 2023 | $854 | $8,798 | $2,202 | $6,596 |
| 2022 | $776 | $8,379 | $1,760 | $6,619 |
| 2021 | $772 | $8,741 | $1,760 | $6,981 |
| 2020 | $783 | $8,706 | $1,760 | $6,946 |
| 2019 | $754 | $8,141 | $1,760 | $6,381 |
| 2018 | $783 | $8,470 | $1,760 | $6,710 |
| 2017 | $772 | $8,407 | $1,760 | $6,647 |
| 2016 | $770 | $8,204 | $1,760 | $6,444 |
| 2015 | $746 | $8,043 | $1,760 | $6,283 |
| 2014 | $737 | $7,945 | $1,760 | $6,185 |
Source: Public Records
Map
Nearby Homes
- 16111 Oklahoma 88
- 121 W 9th Place S
- 203 W 9th St S
- 809 S Muskogee Ave
- 507 S Maryland Ave
- 321 E Patti Page Blvd
- 402 E Patti Page Blvd
- 417 E Will Rogers Blvd
- 317 E 4th St
- 202 W 4th St
- 522 E 6th St
- 520 E 6th St
- 221 N Dorothy Ave
- 21755 Country Ridge Ln
- 104 W 7th St
- 1410 W Danny St
- 0 E 540 Unit 2531424
- 3304 Harbour Town
- 6050 E Chestnut
- 0 E 500 Unit 2545008
- 308 E Fry Place
- 708 S Choctaw Ave
- 314 E Fry Place
- 706 S Choctaw Ave
- 802 S Choctaw Ave
- 315 E Fry St
- 303 E Fry Place
- 309 E Fry St
- 320 E Fry Place
- 702 S Choctaw Ave
- 309 E Fry Place
- 315 E Fry St
- 315 E Fry Place
- 804 S Choctaw Ave
- 317 E Fry Place
- 701 S Choctaw Place
- 713 S Choctaw Ave
- 717 S Choctaw Ave
- 709 S Choctaw Ave
- 806 S Choctaw Ave