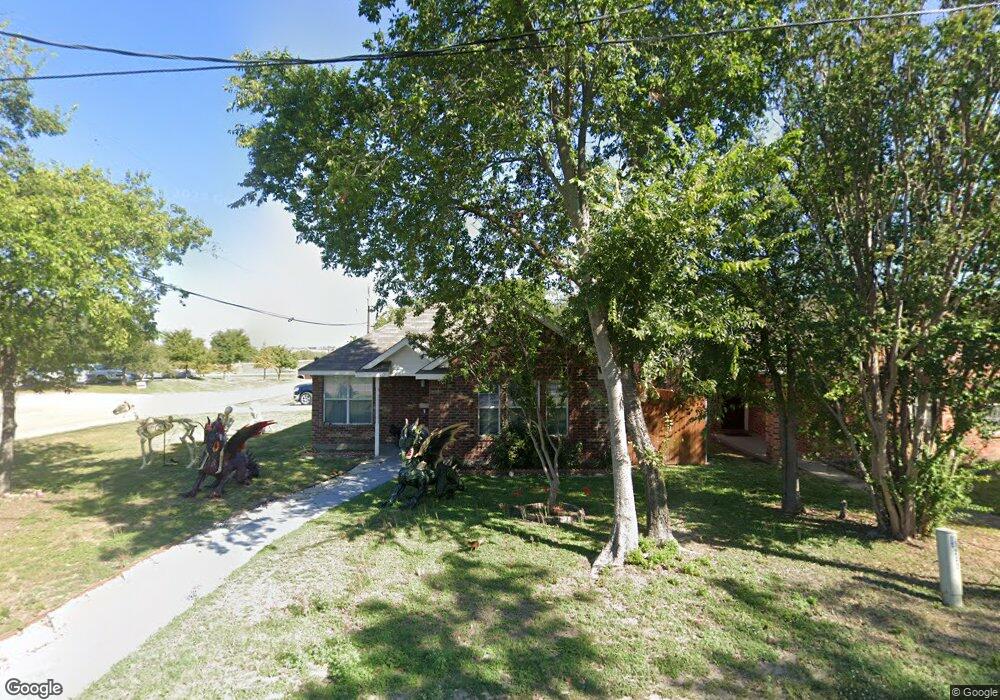
302 E Maple St Celina, TX 75009
Estimated Value: $290,000 - $404,000
3
Beds
2
Baths
1,209
Sq Ft
$289/Sq Ft
Est. Value
About This Home
This home is located at 302 E Maple St, Celina, TX 75009 and is currently estimated at $349,248, approximately $288 per square foot. 302 E Maple St is a home located in Collin County with nearby schools including Celina Primary School, Moore Middle School, and Celina High School.
Ownership History
Date
Name
Owned For
Owner Type
Purchase Details
Closed on
Mar 8, 2019
Sold by
Stone Rhett
Bought by
Hernandez Sandra Edith and Carrera Elsa Paulina
Current Estimated Value
Home Financials for this Owner
Home Financials are based on the most recent Mortgage that was taken out on this home.
Original Mortgage
$175,750
Outstanding Balance
$154,514
Interest Rate
4.4%
Mortgage Type
Purchase Money Mortgage
Estimated Equity
$194,734
Purchase Details
Closed on
Jul 25, 2003
Sold by
Sturkie Paul M
Bought by
Sturkie Paul M and Woodstone Homes
Home Financials for this Owner
Home Financials are based on the most recent Mortgage that was taken out on this home.
Original Mortgage
$84,720
Interest Rate
5.19%
Mortgage Type
Unknown
Create a Home Valuation Report for This Property
The Home Valuation Report is an in-depth analysis detailing your home's value as well as a comparison with similar homes in the area
Home Values in the Area
Average Home Value in this Area
Purchase History
| Date | Buyer | Sale Price | Title Company |
|---|---|---|---|
| Hernandez Sandra Edith | -- | Republic Title Of Texas | |
| Rodriguez Sandra Edith Hernandez | -- | Republic Title Of Texas | |
| Sturkie Paul M | -- | -- |
Source: Public Records
Mortgage History
| Date | Status | Borrower | Loan Amount |
|---|---|---|---|
| Open | Rodriguez Sandra Edith Hernandez | $175,750 | |
| Closed | Hernandez Sandra Edith | $175,750 | |
| Previous Owner | Sturkie Paul M | $84,720 |
Source: Public Records
Tax History
| Year | Tax Paid | Tax Assessment Tax Assessment Total Assessment is a certain percentage of the fair market value that is determined by local assessors to be the total taxable value of land and additions on the property. | Land | Improvement |
|---|---|---|---|---|
| 2025 | $4,705 | $321,280 | $180,000 | $152,286 |
| 2024 | $4,725 | $292,073 | $150,000 | $142,073 |
| 2023 | $4,725 | $324,928 | $120,000 | $226,756 |
| 2022 | $6,770 | $295,389 | $80,000 | $215,389 |
| 2021 | $4,285 | $183,494 | $30,000 | $153,494 |
| 2020 | $4,244 | $173,203 | $30,000 | $143,203 |
| 2019 | $3,718 | $145,961 | $30,000 | $140,195 |
| 2018 | $3,393 | $132,692 | $24,000 | $119,990 |
| 2017 | $3,085 | $150,882 | $24,000 | $126,882 |
| 2016 | $2,823 | $122,955 | $8,000 | $114,955 |
| 2015 | $1,648 | $101,128 | $8,000 | $93,128 |
Source: Public Records
Map
Nearby Homes
- 406 E Maple St
- 410 N Texas St
- Lot 2 Louisiana
- Lot 1 Louisiana
- 1128 Wheatgrass Mews
- 416 Dover Mews
- 220 Chestnut St
- 403 E Pecan St
- 504 E Pecan St
- 300 Chestnut St
- 212 E Walnut St
- 101 Chestnut St
- 316 Chestnut St
- 309 Chestnut St
- 329 Callum Pkwy
- 324 Chestnut St
- 317 Chestnut St
- 309 E Walnut St
- 332 Chestnut St
- 516 Stark Mews
- 304 E Maple St
- 306 E Maple St
- 303 E Malone St
- 412 N Oklahoma Dr
- 301 E Maple St
- 455 N Oklahoma Dr
- 305 E Maple St
- 312 W Maple St
- 312 N New Mexico St
- 312 N New Mexico Dr
- 308 N New Mexico St
- 302 S Oklahoma Dr
- 302 S Oklahoma Dr
- 302 E Beech St
- 304 E Beech St
- 306 E Beech St
- 404 E Maple St
- 312 E Beech St
- 000 E Malone St
- 401 E Maple St
Your Personal Tour Guide
Ask me questions while you tour the home.