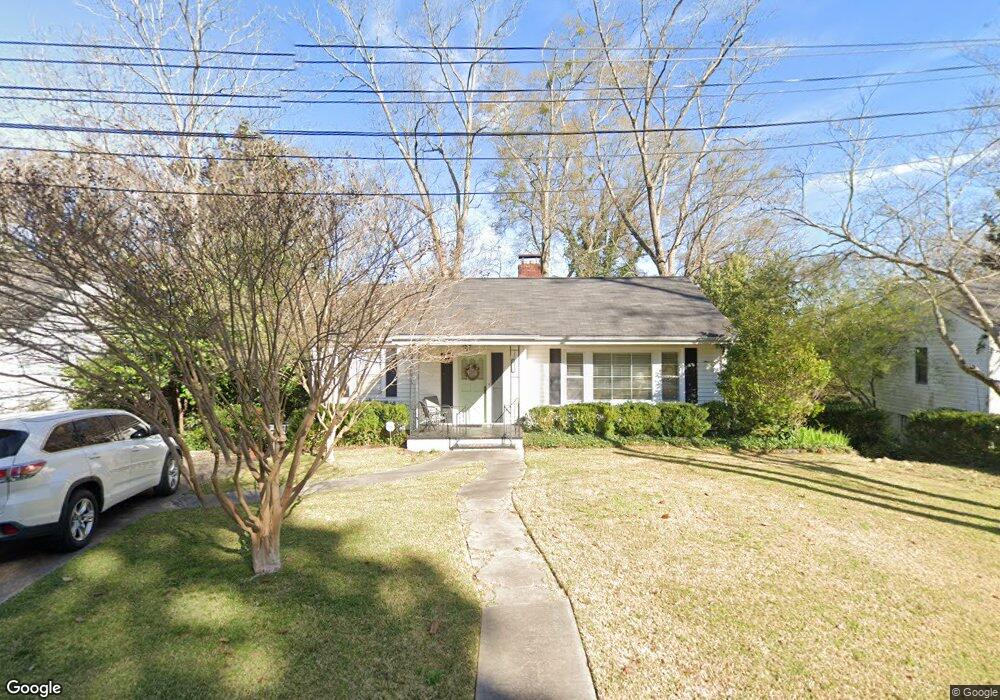
302 E Mclendon Cir Lagrange, GA 30240
Estimated Value: $223,000 - $229,000
3
Beds
1
Bath
1,154
Sq Ft
$196/Sq Ft
Est. Value
About This Home
This home is located at 302 E Mclendon Cir, Lagrange, GA 30240 and is currently estimated at $225,690, approximately $195 per square foot. 302 E Mclendon Cir is a home located in Troup County with nearby schools including Hollis Hand Elementary School, Ethel W. Kight Elementary School, and Franklin Forest Elementary School.
Ownership History
Date
Name
Owned For
Owner Type
Purchase Details
Closed on
Aug 17, 2023
Sold by
Sharp Paula J
Bought by
Elder Luke Jared
Current Estimated Value
Home Financials for this Owner
Home Financials are based on the most recent Mortgage that was taken out on this home.
Original Mortgage
$160,000
Outstanding Balance
$155,858
Interest Rate
6.78%
Mortgage Type
New Conventional
Estimated Equity
$69,832
Purchase Details
Closed on
Mar 23, 2020
Sold by
Johnston Mary Frances
Bought by
Sharp Paula J and Sharp Roger W
Purchase Details
Closed on
May 26, 2009
Sold by
Holle J Michael
Bought by
Mcneel Lisa D
Purchase Details
Closed on
May 31, 2002
Sold by
Sharon L Harper
Bought by
Holle J Michael
Purchase Details
Closed on
Aug 1, 1994
Sold by
Virgie W Webb
Bought by
Sharon L Harper
Purchase Details
Closed on
Apr 21, 1955
Sold by
Dodd B T
Bought by
Virgie W Webb
Create a Home Valuation Report for This Property
The Home Valuation Report is an in-depth analysis detailing your home's value as well as a comparison with similar homes in the area
Purchase History
| Date | Buyer | Sale Price | Title Company |
|---|---|---|---|
| Elder Luke Jared | $200,000 | -- | |
| Sharp Paula J | $139,900 | -- | |
| Mcneel Lisa D | $133,000 | -- | |
| Mcneel Lisa D | $133,000 | -- | |
| Holle J Michael | $87,000 | -- | |
| Sharon L Harper | $48,000 | -- | |
| Virgie W Webb | -- | -- |
Source: Public Records
Mortgage History
| Date | Status | Borrower | Loan Amount |
|---|---|---|---|
| Open | Elder Luke Jared | $160,000 |
Source: Public Records
Tax History
| Year | Tax Paid | Tax Assessment Tax Assessment Total Assessment is a certain percentage of the fair market value that is determined by local assessors to be the total taxable value of land and additions on the property. | Land | Improvement |
|---|---|---|---|---|
| 2025 | $2,182 | $80,000 | $17,848 | $62,152 |
| 2024 | $2,182 | $80,000 | $17,848 | $62,152 |
| 2023 | $1,640 | $60,120 | $18,000 | $42,120 |
| 2022 | $1,506 | $53,960 | $14,000 | $39,960 |
| 2021 | $1,613 | $53,480 | $14,000 | $39,480 |
| 2020 | $1,577 | $52,280 | $14,000 | $38,280 |
| 2019 | $1,387 | $46,000 | $14,000 | $32,000 |
| 2018 | $1,387 | $46,000 | $14,000 | $32,000 |
| 2017 | $1,363 | $45,200 | $18,000 | $27,200 |
| 2016 | $1,379 | $45,728 | $18,000 | $27,728 |
| 2015 | $1,381 | $45,728 | $18,000 | $27,728 |
| 2014 | $1,366 | $45,156 | $18,000 | $27,156 |
| 2013 | -- | $25,583 | $6,168 | $19,415 |
Source: Public Records
Map
Nearby Homes
- 598 Edmondson Ave
- 105 Saynor Cir
- 120 Saynor Cir
- 203 Waverly Way
- 206 Broad St
- 216 E Lane Cir
- 405 W Broome St Unit 2
- 405 W Broome St Unit 3
- 405 W Broome St Unit 4
- 405 W Broome St Unit 1
- 405 W Broome St Unit 5
- 208 Boulevard
- 119 College Ave
- 705 Piney Woods Dr
- 304 Boulevard
- 609 Ridley Ave
- 707 Ridley Ave
- 611 Ridley Ave
- 615 Ridley Ave
- 709 Ridley Ave
- 306 E Mclendon Cir
- 300 E Mclendon Cir
- 308 E Mclendon Cir
- 202 Ben Hill St
- 205 Gordon St
- E E Mclendon Cir
- 207 Gordon St
- 204 Ben Hill St
- 310 E Mclendon Cir
- 500 W Haralson St Unit 1
- 201 Gordon St
- 314 E Mclendon Cir
- 203 Ben Hill St
- 301 Gordon St
- 301 W Mclendon Cir
- 201 Ben Hill St #4
- 201 Ben Hill #3
- 201 Ben Hill St Unit 4
- 201 Ben Hill St Unit 4
- 201 Ben Hill St Unit 2
Your Personal Tour Guide
Ask me questions while you tour the home.