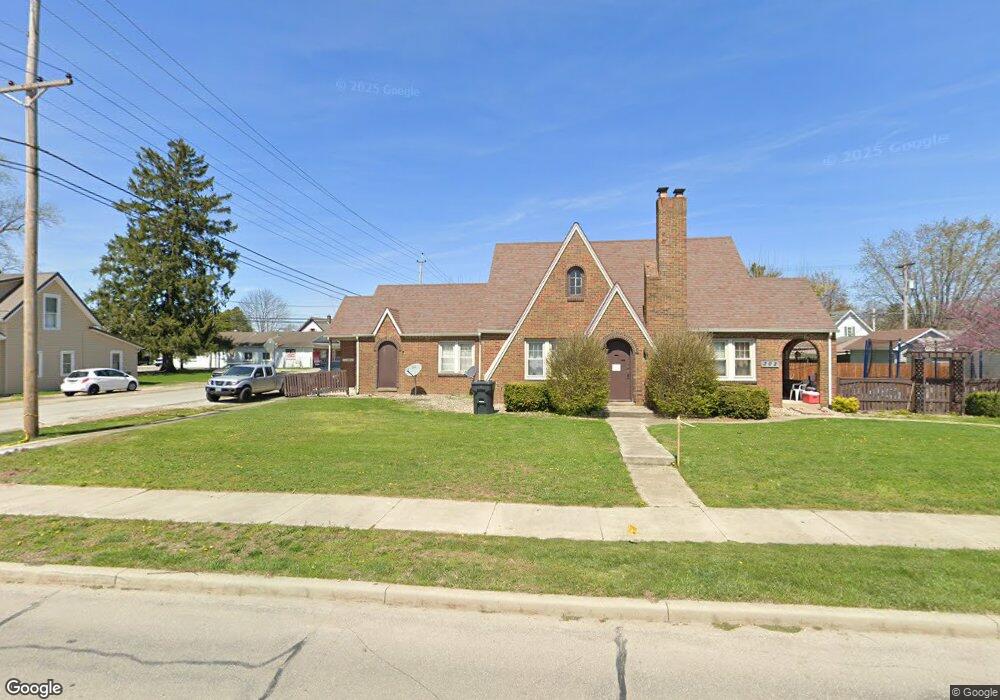
302 E Sigler St Frankton, IN 46044
Estimated Value: $184,000 - $240,000
5
Beds
3
Baths
2,390
Sq Ft
$90/Sq Ft
Est. Value
About This Home
This home is located at 302 E Sigler St, Frankton, IN 46044 and is currently estimated at $215,285, approximately $90 per square foot. 302 E Sigler St is a home located in Madison County with nearby schools including Frankton Elementary School and Frankton Junior/Senior High School.
Ownership History
Date
Name
Owned For
Owner Type
Purchase Details
Closed on
Jul 2, 2025
Sold by
Westover Jason
Bought by
Westover Jason and Westover Amberlee M
Current Estimated Value
Purchase Details
Closed on
Aug 16, 2021
Sold by
Beamer Douglas L and Beamer Ana P
Bought by
Westover Jason
Home Financials for this Owner
Home Financials are based on the most recent Mortgage that was taken out on this home.
Original Mortgage
$166,920
Interest Rate
2.8%
Mortgage Type
FHA
Create a Home Valuation Report for This Property
The Home Valuation Report is an in-depth analysis detailing your home's value as well as a comparison with similar homes in the area
Home Values in the Area
Average Home Value in this Area
Purchase History
| Date | Buyer | Sale Price | Title Company |
|---|---|---|---|
| Westover Jason | -- | None Listed On Document | |
| Westover Jason | $170,000 | Chicago Title |
Source: Public Records
Mortgage History
| Date | Status | Borrower | Loan Amount |
|---|---|---|---|
| Previous Owner | Westover Jason | $166,920 |
Source: Public Records
Tax History
| Year | Tax Paid | Tax Assessment Tax Assessment Total Assessment is a certain percentage of the fair market value that is determined by local assessors to be the total taxable value of land and additions on the property. | Land | Improvement |
|---|---|---|---|---|
| 2025 | $1,232 | $133,800 | $9,700 | $124,100 |
| 2024 | $1,232 | $123,200 | $7,800 | $115,400 |
| 2023 | $1,123 | $112,300 | $7,400 | $104,900 |
| 2022 | $1,118 | $111,800 | $6,900 | $104,900 |
| 2021 | $1,017 | $102,200 | $6,400 | $95,800 |
| 2020 | $2,050 | $102,500 | $6,100 | $96,400 |
| 2019 | $1,994 | $99,700 | $6,100 | $93,600 |
| 2018 | $1,897 | $93,600 | $6,100 | $87,500 |
| 2017 | $1,848 | $92,400 | $6,100 | $86,300 |
| 2016 | $1,765 | $87,000 | $6,100 | $80,900 |
| 2014 | $746 | $85,800 | $6,100 | $79,700 |
| 2013 | $746 | $86,100 | $6,100 | $80,000 |
Source: Public Records
Map
Nearby Homes
Your Personal Tour Guide
Ask me questions while you tour the home.