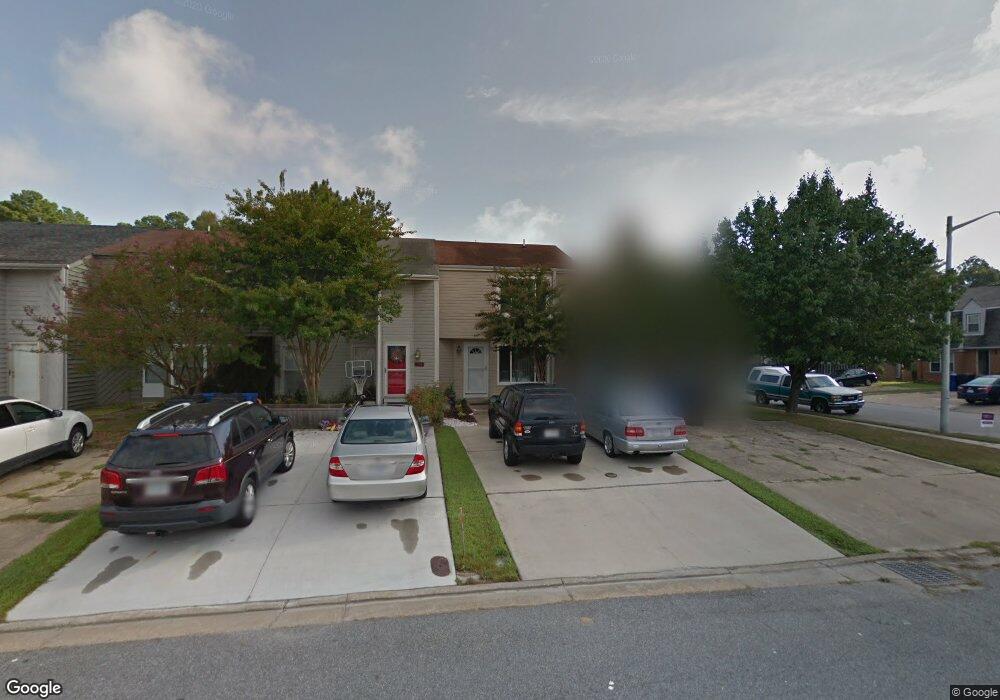
302 Falling Ln Virginia Beach, VA 23454
Great Neck NeighborhoodEstimated Value: $249,000 - $267,000
2
Beds
2
Baths
1,178
Sq Ft
$221/Sq Ft
Est. Value
About This Home
This home is located at 302 Falling Ln, Virginia Beach, VA 23454 and is currently estimated at $260,267, approximately $220 per square foot. 302 Falling Ln is a home located in Virginia Beach City with nearby schools including King's Grant Elementary School, Great Neck Middle School, and Frank W. Cox High School.
Ownership History
Date
Name
Owned For
Owner Type
Purchase Details
Closed on
Apr 28, 2014
Sold by
Caporale Patricia
Bought by
Mason Laura
Current Estimated Value
Home Financials for this Owner
Home Financials are based on the most recent Mortgage that was taken out on this home.
Original Mortgage
$162,305
Outstanding Balance
$124,122
Interest Rate
4.5%
Mortgage Type
FHA
Estimated Equity
$136,145
Purchase Details
Closed on
May 29, 2008
Sold by
Morris Ann R
Bought by
Caporale Patricia
Home Financials for this Owner
Home Financials are based on the most recent Mortgage that was taken out on this home.
Original Mortgage
$166,388
Interest Rate
5.91%
Mortgage Type
FHA
Purchase Details
Closed on
Mar 16, 2001
Sold by
Amdursky Harold R
Bought by
Morris Ann R
Home Financials for this Owner
Home Financials are based on the most recent Mortgage that was taken out on this home.
Original Mortgage
$67,954
Interest Rate
7.05%
Create a Home Valuation Report for This Property
The Home Valuation Report is an in-depth analysis detailing your home's value as well as a comparison with similar homes in the area
Home Values in the Area
Average Home Value in this Area
Purchase History
| Date | Buyer | Sale Price | Title Company |
|---|---|---|---|
| Mason Laura | $165,300 | -- | |
| Caporale Patricia | $169,000 | -- | |
| Morris Ann R | $68,500 | -- |
Source: Public Records
Mortgage History
| Date | Status | Borrower | Loan Amount |
|---|---|---|---|
| Open | Mason Laura | $162,305 | |
| Previous Owner | Caporale Patricia | $166,388 | |
| Previous Owner | Morris Ann R | $67,954 |
Source: Public Records
Tax History
| Year | Tax Paid | Tax Assessment Tax Assessment Total Assessment is a certain percentage of the fair market value that is determined by local assessors to be the total taxable value of land and additions on the property. | Land | Improvement |
|---|---|---|---|---|
| 2025 | $2,172 | $234,700 | $95,000 | $139,700 |
| 2024 | $2,172 | $223,900 | $88,000 | $135,900 |
Source: Public Records
Map
Nearby Homes
- 456 Falling Ln
- 417 Rennie Ct
- 405 Hidden Shores Ct Unit 104
- 2524 Hidden Shores Dr Unit 104
- 2502 Longleaf Ct
- 2449 Reagan Ave
- 393 River Forest Rd
- 2425 London Pointe Dr
- 400 Egret Landing Unit 202
- 505 Torrey Ct
- 309 Windship Cove
- 451 Chatterton Dr
- 314 Windship Cove
- 302 Windship Cove
- 2608 E Kings Rd
- 2408 Julie Ct
- 2304 Cretan Ct
- 2400 Julie Ct
- 2317 Cretan Ct
- 557 Longleaf Rd
- 304 Falling Ln
- 300 Falling Ln
- 306 Falling Ln
- 308 Falling Ln
- 310 Falling Ln
- 2521 Reagan Ave
- 2519 Reagan Ave
- 2523 Reagan Ave
- 312 Falling Ln
- 2525 Reagan Ave
- 2527 Reagan Ave
- 314 Falling Ln
- 2529 Reagan Ave
- 492 Falling Ln
- 2531 Reagan Ave
- 490 Falling Ln
- 2517 Reagan Ave
- 488 Falling Ln
- 494 Falling Ln
- 303 Falling Ln
Your Personal Tour Guide
Ask me questions while you tour the home.