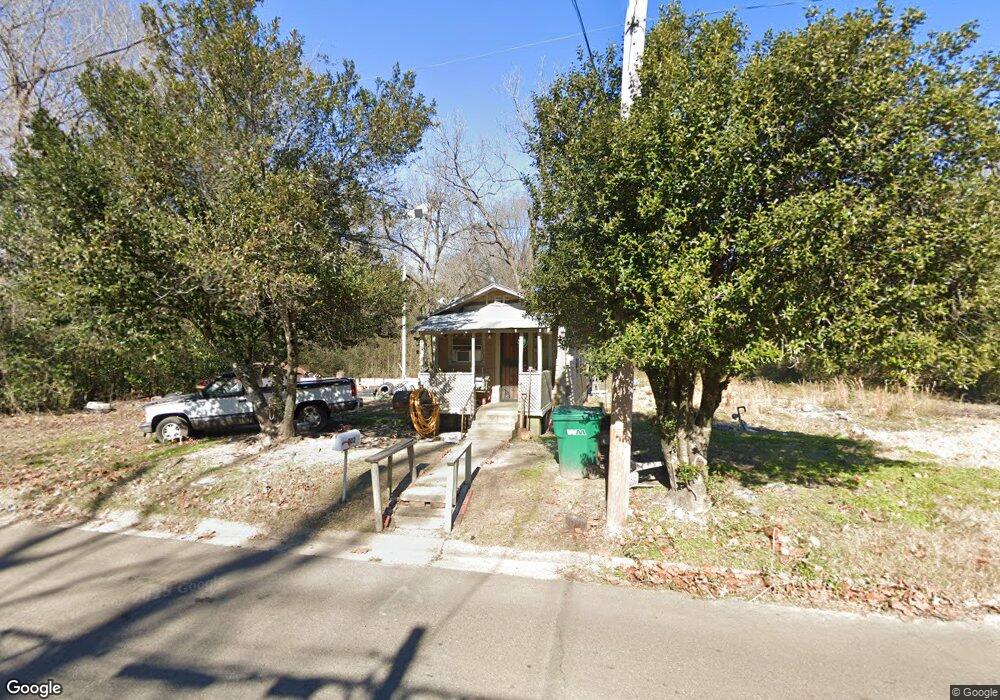
302 Findley St Texarkana, TX 75501
Estimated Value: $27,752 - $135,000
--
Bed
--
Bath
504
Sq Ft
$148/Sq Ft
Est. Value
About This Home
This home is located at 302 Findley St, Texarkana, TX 75501 and is currently estimated at $74,438, approximately $147 per square foot. 302 Findley St is a home located in Bowie County with nearby schools including Theron Jones Early Literacy Center, Westlawn Elementary School, and Texas Middle School.
Create a Home Valuation Report for This Property
The Home Valuation Report is an in-depth analysis detailing your home's value as well as a comparison with similar homes in the area
Home Values in the Area
Average Home Value in this Area
Tax History Compared to Growth
Tax History
| Year | Tax Paid | Tax Assessment Tax Assessment Total Assessment is a certain percentage of the fair market value that is determined by local assessors to be the total taxable value of land and additions on the property. | Land | Improvement |
|---|---|---|---|---|
| 2025 | $103 | $7,708 | $500 | $7,208 |
| 2024 | $103 | $4,361 | $500 | $3,861 |
| 2023 | $103 | $4,361 | $500 | $3,861 |
| 2022 | $94 | $3,948 | $500 | $3,448 |
| 2021 | $34 | $1,321 | $500 | $821 |
| 2020 | $31 | $1,214 | $500 | $714 |
| 2019 | $32 | $1,214 | $500 | $714 |
| 2018 | $32 | $1,214 | $500 | $714 |
| 2017 | $32 | $1,199 | $500 | $699 |
| 2016 | $32 | $1,199 | $500 | $699 |
| 2015 | $67 | $1,199 | $500 | $699 |
| 2014 | $67 | $2,599 | $500 | $2,099 |
Source: Public Records
Map
Nearby Homes
- 1020 Capp St
- 917 Capp St
- 0 Tbd5 St N Unit 116364
- 0 Tbd2 St N Unit 116418
- 0 Tbd1 St N Unit 116420
- 1306 Caldwell St
- 1104 Caldwell St
- 1304 Caldwell St
- 1622 Lee St
- 2122 Parkham St
- 1309 West St
- 0 Tbd 1 Ann St
- 0 Tbd 1 St W Unit 116362
- 1601 Harlem
- 264 S Lake Dr
- 1522 Nolthenius St
- 1121 Nolthenius St
- TBD Ward Ave
- 1227 W 5th St
- 1222 W 6th St