Estimated Value: $718,671 - $1,171,000
9
Beds
3
Baths
3,267
Sq Ft
$306/Sq Ft
Est. Value
About This Home
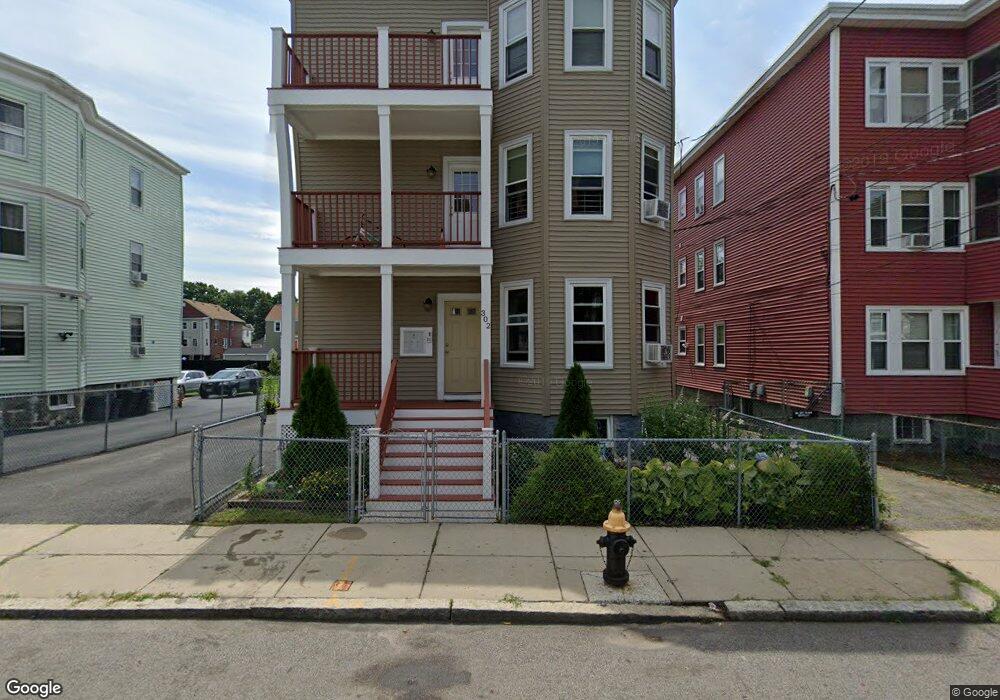
This home is located at 302 Fuller St, Dorchester Center, MA 02124 and is currently estimated at $998,168, approximately $305 per square foot. 302 Fuller St is a home located in Suffolk County with nearby schools including Epiphany School.
Ownership History
Date
Name
Owned For
Owner Type
Purchase Details
Closed on
Sep 20, 2013
Sold by
Cfhm Properties Llc
Bought by
Campbell Cecilia
Current Estimated Value
Home Financials for this Owner
Home Financials are based on the most recent Mortgage that was taken out on this home.
Original Mortgage
$288,000
Outstanding Balance
$215,085
Interest Rate
4.42%
Mortgage Type
New Conventional
Estimated Equity
$783,083
Purchase Details
Closed on
Nov 8, 2012
Sold by
Boston City Of
Bought by
Cfhm Props Llc
Home Financials for this Owner
Home Financials are based on the most recent Mortgage that was taken out on this home.
Original Mortgage
$725,375
Interest Rate
3.42%
Mortgage Type
Purchase Money Mortgage
Purchase Details
Closed on
Apr 3, 2009
Sold by
Bra
Bought by
Boston City Of
Purchase Details
Closed on
Jan 12, 2009
Sold by
Boswell Chris and Bank Of New York
Bought by
Bank Of New York
Purchase Details
Closed on
Jan 16, 2004
Sold by
Mcpherson Lucian V
Bought by
Boswell Chris
Home Financials for this Owner
Home Financials are based on the most recent Mortgage that was taken out on this home.
Original Mortgage
$499,999
Interest Rate
5.98%
Mortgage Type
Purchase Money Mortgage
Create a Home Valuation Report for This Property
The Home Valuation Report is an in-depth analysis detailing your home's value as well as a comparison with similar homes in the area
Home Values in the Area
Average Home Value in this Area
Purchase History
| Date | Buyer | Sale Price | Title Company |
|---|---|---|---|
| Campbell Cecilia | $340,000 | -- | |
| Campbell Cecilia | $340,000 | -- | |
| Cfhm Props Llc | $575,785 | -- | |
| Boston City Of | $176,000 | -- | |
| Bra | $176,000 | -- | |
| Bank Of New York | $554,463 | -- | |
| Boswell Chris | $561,000 | -- |
Source: Public Records
Mortgage History
| Date | Status | Borrower | Loan Amount |
|---|---|---|---|
| Open | Campbell Cecilia | $288,000 | |
| Closed | Campbell Cecilia | $288,000 | |
| Previous Owner | Cfhm Props Llc | $725,375 | |
| Previous Owner | Boswell Chris | $499,999 | |
| Previous Owner | Boswell Chris | $280,000 | |
| Previous Owner | Boswell Chris | $275,000 |
Source: Public Records
Tax History Compared to Growth
Tax History
| Year | Tax Paid | Tax Assessment Tax Assessment Total Assessment is a certain percentage of the fair market value that is determined by local assessors to be the total taxable value of land and additions on the property. | Land | Improvement |
|---|---|---|---|---|
| 2025 | $6,413 | $553,800 | $142,398 | $411,402 |
| 2024 | $5,749 | $527,400 | $142,398 | $385,002 |
| 2023 | $5,395 | $502,300 | $135,621 | $366,679 |
| 2022 | $5,205 | $478,400 | $129,168 | $349,232 |
| 2021 | $4,861 | $455,600 | $0 | $455,600 |
| 2020 | $4,582 | $433,900 | $0 | $433,900 |
| 2019 | $4,355 | $413,200 | $182,200 | $231,000 |
| 2018 | $4,124 | $393,500 | $182,200 | $211,300 |
| 2017 | $3,969 | $374,800 | $179,700 | $195,100 |
| 2016 | $3,927 | $357,000 | $179,700 | $177,300 |
| 2015 | $4,117 | $340,000 | $139,600 | $200,400 |
| 2014 | $4,277 | $340,000 | $139,600 | $200,400 |
Source: Public Records
Map
Nearby Homes
- 230 Fuller St
- 139 Selden St
- 44 Evans St
- 808 Morton St Unit 3
- 30 Glenhill Rd
- 64 Stockton St
- 23 Maryknoll St
- 84-86 Codman Hill Ave
- 81 Mora St
- 183 Fuller St Unit 1
- 72 Mora St
- 71 W Selden St Unit 3
- 56 Fairmount St Unit 2
- 240 Norfolk St
- 238 Norfolk St
- 251 Norfolk St Unit A
- 44 Mora St
- 56 Oakridge St
- 30 Pleasant Hill Ave Unit 32
- 50 Armandine St
- 302 Fuller St Unit 2
- 306 Fuller St
- 298 Fuller St
- 310 Fuller St Unit 3
- 310 Fuller St Unit 2
- 310 Fuller St Unit 1
- 310 Fuller St
- 294 Fuller St
- 290 Fuller St Unit 292
- 290-292 Fuller St
- 290 Fuller St Unit 1
- 290 Fuller St Unit 3
- 189 Fairmount St
- 314 Fuller St Unit 6
- 314 Fuller St Unit 1
- 314 Fuller St Unit 4
- 314 Fuller St Unit 5
- 185 Fairmount St
- 193 Fairmount St
- 301 Fuller St Unit 3