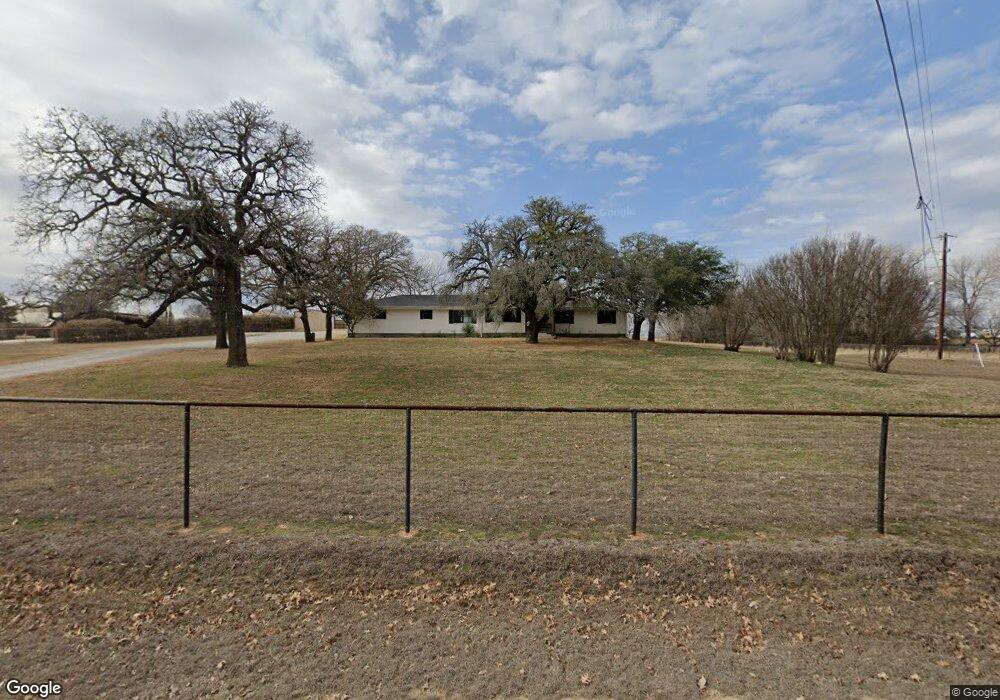
302 Greenwood Cut Off Rd Weatherford, TX 76088
Estimated Value: $523,000 - $565,979
4
Beds
3
Baths
2,536
Sq Ft
$215/Sq Ft
Est. Value
About This Home
This home is located at 302 Greenwood Cut Off Rd, Weatherford, TX 76088 and is currently estimated at $544,490, approximately $214 per square foot. 302 Greenwood Cut Off Rd is a home located in Parker County with nearby schools including Wright Elementary School, Hall Middle School, and Weatherford High School.
Ownership History
Date
Name
Owned For
Owner Type
Purchase Details
Closed on
Sep 14, 2018
Sold by
Qfc Services Llc
Bought by
Rodgers Andrew and Rodgers Michael
Current Estimated Value
Home Financials for this Owner
Home Financials are based on the most recent Mortgage that was taken out on this home.
Original Mortgage
$302,100
Outstanding Balance
$262,934
Interest Rate
4.6%
Mortgage Type
New Conventional
Estimated Equity
$281,556
Purchase Details
Closed on
Dec 11, 2017
Sold by
Barnett Tommy K and Barnett Corrie A
Bought by
Qfc Services Llc
Purchase Details
Closed on
Sep 27, 1995
Sold by
Clutts Bette L Exec Of Est M Christine Barnet
Bought by
Barnett Tommy Keith
Purchase Details
Closed on
Apr 26, 1993
Bought by
Barnett Tommy Keith
Purchase Details
Closed on
Jan 1, 1901
Bought by
Barnett Tommy Keith
Create a Home Valuation Report for This Property
The Home Valuation Report is an in-depth analysis detailing your home's value as well as a comparison with similar homes in the area
Home Values in the Area
Average Home Value in this Area
Purchase History
| Date | Buyer | Sale Price | Title Company |
|---|---|---|---|
| Rodgers Andrew | -- | Stewart Title | |
| Qfc Services Llc | $26,387 | None Available | |
| Barnett Tommy Keith | -- | -- | |
| Barnett Tommy Keith | -- | -- | |
| Barnett Tommy Keith | -- | -- |
Source: Public Records
Mortgage History
| Date | Status | Borrower | Loan Amount |
|---|---|---|---|
| Open | Rodgers Andrew | $302,100 |
Source: Public Records
Tax History Compared to Growth
Tax History
| Year | Tax Paid | Tax Assessment Tax Assessment Total Assessment is a certain percentage of the fair market value that is determined by local assessors to be the total taxable value of land and additions on the property. | Land | Improvement |
|---|---|---|---|---|
| 2025 | $5,905 | $468,984 | -- | -- |
| 2024 | $5,905 | $426,349 | -- | -- |
| 2023 | $5,905 | $387,590 | $0 | $0 |
| 2022 | $6,560 | $352,360 | $77,360 | $275,000 |
| 2021 | $6,919 | $352,360 | $77,360 | $275,000 |
| 2020 | $6,321 | $311,620 | $62,580 | $249,040 |
| 2019 | $5,939 | $274,480 | $25,440 | $249,040 |
| 2018 | $4,072 | $187,210 | $14,340 | $172,870 |
| 2017 | $3,767 | $187,210 | $14,340 | $172,870 |
| 2016 | $3,425 | $154,290 | $14,340 | $139,950 |
| 2015 | $3,010 | $154,290 | $14,340 | $139,950 |
| 2014 | $2,949 | $149,720 | $14,340 | $135,380 |
Source: Public Records
Map
Nearby Homes
- 100 Overton Ridge Cir
- 1035 Estancia Blvd
- 1027 Estancia Blvd
- 4009 Estancia Ct
- 2056 Vaquero Dr
- 2435 Old Mineral Wells Hwy
- 3703 Greenwood Rd
- 119 Michael Ln
- 105 Michael Ln
- 103 Saddle Club Rd
- 119 Forest Creek Cir
- 134 Forest Creek Cir
- 1930 Old Mineral Wells Hwy
- 209 Grace Ct
- TBD Old Mineral Wells Hwy
- 1882 Old Mineral Wells Hwy
- 142 Wood Oak Trail
- 4710 Mineral Wells Hwy
- 1802 Greenwood Rd
- 121 Desperado Way
- 310 Greenwood Cut Off Rd
- 303 Greenwood Cut Off Rd
- 220 Greenwood Cut Off Rd
- 311 Greenwood Cut Off Rd
- 225 Greenwood Cut Off Rd
- 320 Greenwood Cut Off Rd
- 320 Greenwood Cut Off Rd
- 109 Country Oaks Ln
- 105 Greenwood Oaks Dr
- 106 Country Oaks Ln
- 117 Greenwood Oaks Dr
- 215 Greenwood Cut Off Rd
- 590 Greenwood Cut Off Rd
- 210 Greenwood Cut Off Rd
- 112 Country Oaks Ln
- 104 Greenwood Oaks Dr
- 602 Greenwood Cut Off Rd
- 125 Greenwood Oaks Dr
- 116 Greenwood Oaks Dr
- 120 Country Oaks Ln