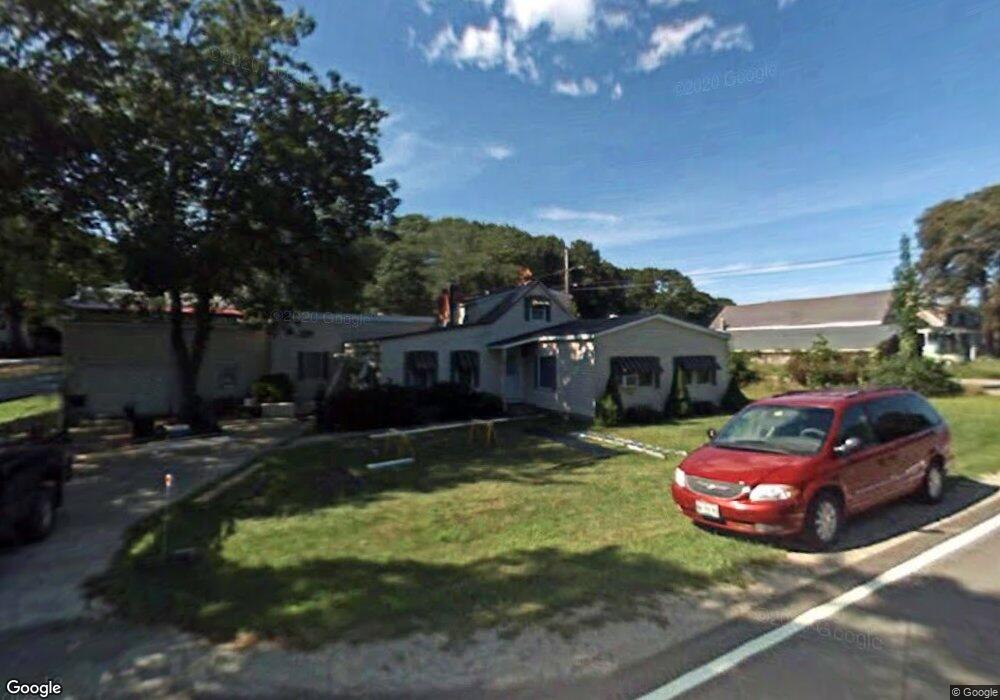
302 Guinea Rd Biddeford, ME 04005
South Biddeford NeighborhoodEstimated Value: $421,670 - $504,000
3
Beds
2
Baths
1,856
Sq Ft
$256/Sq Ft
Est. Value
About This Home
This home is located at 302 Guinea Rd, Biddeford, ME 04005 and is currently estimated at $474,668, approximately $255 per square foot. 302 Guinea Rd is a home located in York County with nearby schools including John F Kennedy Memorial School, Biddeford Primary School, and Biddeford Intermediate School.
Ownership History
Date
Name
Owned For
Owner Type
Purchase Details
Closed on
Jun 5, 2006
Sold by
Hooper Douglas P and Hooper Sharon K
Bought by
Connolly Doreen R and Lichtenberg John M
Current Estimated Value
Home Financials for this Owner
Home Financials are based on the most recent Mortgage that was taken out on this home.
Original Mortgage
$209,800
Outstanding Balance
$119,869
Interest Rate
6.55%
Mortgage Type
Purchase Money Mortgage
Estimated Equity
$354,800
Purchase Details
Closed on
Jun 2, 2005
Sold by
Hooper Sharon
Bought by
Hooper Douglas P and Hooper Sharon K
Home Financials for this Owner
Home Financials are based on the most recent Mortgage that was taken out on this home.
Original Mortgage
$225,000
Interest Rate
5.83%
Mortgage Type
Purchase Money Mortgage
Create a Home Valuation Report for This Property
The Home Valuation Report is an in-depth analysis detailing your home's value as well as a comparison with similar homes in the area
Home Values in the Area
Average Home Value in this Area
Purchase History
| Date | Buyer | Sale Price | Title Company |
|---|---|---|---|
| Connolly Doreen R | -- | -- | |
| Hooper Douglas P | -- | -- |
Source: Public Records
Mortgage History
| Date | Status | Borrower | Loan Amount |
|---|---|---|---|
| Open | Connolly Doreen R | $209,800 | |
| Previous Owner | Hooper Douglas P | $225,000 |
Source: Public Records
Tax History
| Year | Tax Paid | Tax Assessment Tax Assessment Total Assessment is a certain percentage of the fair market value that is determined by local assessors to be the total taxable value of land and additions on the property. | Land | Improvement |
|---|---|---|---|---|
| 2025 | $4,040 | $270,400 | $143,800 | $126,600 |
| 2024 | $3,811 | $268,000 | $143,800 | $124,200 |
| 2023 | $3,516 | $268,000 | $143,800 | $124,200 |
| 2022 | $3,494 | $212,900 | $78,100 | $134,800 |
| 2021 | $2,840 | $180,800 | $65,100 | $115,700 |
| 2020 | $3,272 | $163,200 | $55,400 | $107,800 |
| 2019 | $2,992 | $163,200 | $55,400 | $107,800 |
| 2018 | $2,940 | $163,200 | $55,400 | $107,800 |
| 2017 | $3,661 | $155,400 | $55,400 | $100,000 |
| 2016 | $3,517 | $155,400 | $55,400 | $100,000 |
| 2015 | $2,831 | $155,400 | $55,400 | $100,000 |
| 2014 | $2,761 | $155,400 | $55,400 | $100,000 |
| 2013 | -- | $171,800 | $54,400 | $117,400 |
Source: Public Records
Map
Nearby Homes
- 6 Proctor Rd Unit B
- 6 Proctor Rd Unit A
- 10 Tow Rd
- 109 Proctor Rd
- 13 Benson
- 5 Moxie Ln
- 400 West St
- 0 Cole Benson Rd
- 0 Newtown Rd
- 2 Burleigh Ln
- 74 Guinea Rd
- 13 Commodore Dr
- Lot 10 Jasper Ln
- Lot 4 Jasper Ln
- Lot 3 Jasper Ln
- Lot 12 Jasper Ln
- Lot 2 Jasper Ln
- Lot 9 Jasper Ln
- Lot 11 Jasper Ln
- Lot 5 Jasper Ln
Your Personal Tour Guide
Ask me questions while you tour the home.