T
Seller's Agent in 2012
Tom Moran
RE/MAX
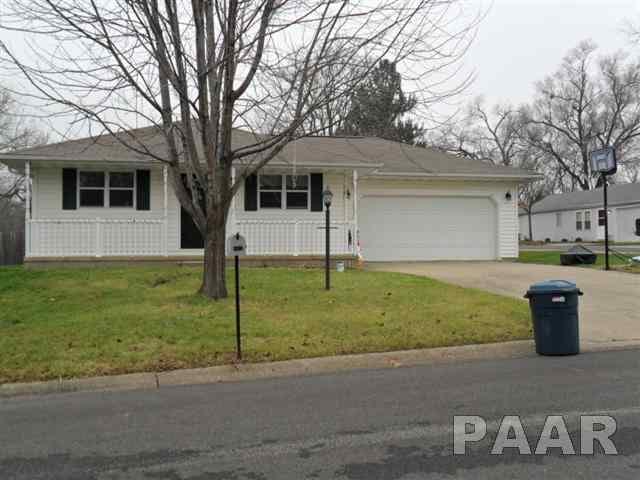
Estimated Value: $89,783 - $165,000
Sold one time show.
Last Agent to Sell the Property
Tom Moran
RE/MAX Preferred Choice License #475122031 Listed on: 12/17/2012
Last Buyer's Agent
Tom Moran
RE/MAX Preferred Choice License #475122031 Listed on: 12/17/2012
| Date | Buyer | Sale Price | Title Company |
|---|---|---|---|
| Moore Angela L | $105,000 | -- |
| Date | Status | Borrower | Loan Amount |
|---|---|---|---|
| Open | Moore Angela L | $86,400 |
| Date | Event | Price | Change | Sq Ft Price |
|---|---|---|---|---|
| 12/17/2012 12/17/12 | Sold | $105,000 | 0.0% | $91 / Sq Ft |
| 12/17/2012 12/17/12 | For Sale | $105,000 | -- | $91 / Sq Ft |
| 11/17/2012 11/17/12 | Pending | -- | -- | -- |
| Year | Tax Paid | Tax Assessment Tax Assessment Total Assessment is a certain percentage of the fair market value that is determined by local assessors to be the total taxable value of land and additions on the property. | Land | Improvement |
|---|---|---|---|---|
| 2024 | $3,520 | $41,210 | $4,370 | $36,840 |
| 2023 | $3,280 | $38,160 | $4,050 | $34,110 |
| 2022 | $3,164 | $36,550 | $3,790 | $32,760 |
| 2021 | $3,019 | $35,140 | $3,640 | $31,500 |
| 2020 | $2,833 | $34,450 | $3,570 | $30,880 |
| 2019 | $2,782 | $34,450 | $3,570 | $30,880 |
| 2018 | $2,717 | $34,440 | $3,560 | $30,880 |
| 2017 | $2,842 | $34,790 | $3,600 | $31,190 |
| 2016 | $2,796 | $35,140 | $3,640 | $31,500 |
| 2015 | $2,708 | $34,450 | $3,570 | $30,880 |
| 2014 | $2,626 | $33,860 | $3,520 | $30,340 |
| 2013 | -- | $33,860 | $3,520 | $30,340 |
T
Seller's Agent in 2012
Tom Moran
RE/MAX
Source: RMLS Alliance
MLS Number: RMAPA1140632
APN: 17-25-301-013
Disclaimer: Certain information contained herein is derived from information provided by parties other than Homes.com. All information provided is deemed reliable, but is not guaranteed to be accurate and should be independently verified.
![]() IDX information is provided exclusively for personal, non-commercial use, and may not be used for any purpose other than to identify prospective properties consumers may be interested in purchasing. Information is deemed reliable but not guaranteed.
IDX information is provided exclusively for personal, non-commercial use, and may not be used for any purpose other than to identify prospective properties consumers may be interested in purchasing. Information is deemed reliable but not guaranteed.
