Estimated Value: $358,000 - $454,000
--
Bed
2
Baths
1,436
Sq Ft
$292/Sq Ft
Est. Value
About This Home
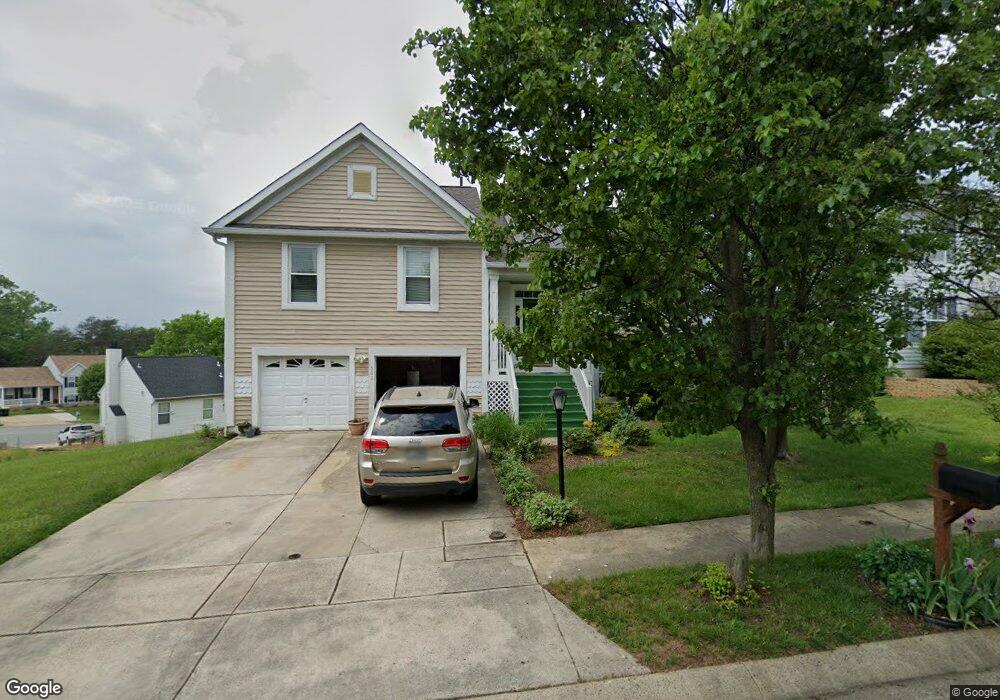
This home is located at 302 Joppa Crossing Way, Joppa, MD 21085 and is currently estimated at $419,742, approximately $292 per square foot. 302 Joppa Crossing Way is a home located in Harford County with nearby schools including Joppatowne Elementary School, Magnolia Middle School, and Joppatowne High School.
Ownership History
Date
Name
Owned For
Owner Type
Purchase Details
Closed on
Oct 2, 2007
Sold by
Leroy Mc Kinstry
Bought by
Taylor Mildred A
Current Estimated Value
Home Financials for this Owner
Home Financials are based on the most recent Mortgage that was taken out on this home.
Original Mortgage
$240,000
Outstanding Balance
$152,799
Interest Rate
6.59%
Mortgage Type
Purchase Money Mortgage
Estimated Equity
$266,943
Purchase Details
Closed on
Sep 24, 2007
Sold by
Leroy Mc Kinstry
Bought by
Taylor Mildred A
Home Financials for this Owner
Home Financials are based on the most recent Mortgage that was taken out on this home.
Original Mortgage
$240,000
Outstanding Balance
$152,799
Interest Rate
6.59%
Mortgage Type
Purchase Money Mortgage
Estimated Equity
$266,943
Purchase Details
Closed on
Apr 5, 1996
Sold by
Newport Homes Limited Liability
Bought by
Leroy Mc Kinstry
Purchase Details
Closed on
Nov 1, 1995
Sold by
Coscan & Adler Limited Partnership
Bought by
Newport Homes Limited Liability and Company
Create a Home Valuation Report for This Property
The Home Valuation Report is an in-depth analysis detailing your home's value as well as a comparison with similar homes in the area
Home Values in the Area
Average Home Value in this Area
Purchase History
| Date | Buyer | Sale Price | Title Company |
|---|---|---|---|
| Taylor Mildred A | $330,000 | -- | |
| Taylor Mildred A | $330,000 | -- | |
| Leroy Mc Kinstry | $153,496 | -- | |
| Newport Homes Limited Liability | $25,500 | -- |
Source: Public Records
Mortgage History
| Date | Status | Borrower | Loan Amount |
|---|---|---|---|
| Open | Taylor Mildred A | $240,000 | |
| Closed | Taylor Mildred A | $240,000 | |
| Closed | Leroy Mc Kinstry | -- |
Source: Public Records
Tax History Compared to Growth
Tax History
| Year | Tax Paid | Tax Assessment Tax Assessment Total Assessment is a certain percentage of the fair market value that is determined by local assessors to be the total taxable value of land and additions on the property. | Land | Improvement |
|---|---|---|---|---|
| 2025 | $3,280 | $318,433 | $0 | $0 |
| 2024 | $3,280 | $300,900 | $81,200 | $219,700 |
| 2023 | $3,225 | $295,933 | $0 | $0 |
| 2022 | $3,171 | $290,967 | $0 | $0 |
| 2021 | $3,171 | $286,000 | $81,200 | $204,800 |
| 2020 | $3,171 | $274,800 | $0 | $0 |
| 2019 | $1,866 | $263,600 | $0 | $0 |
| 2018 | $2,192 | $252,400 | $91,000 | $161,400 |
| 2017 | $2,793 | $252,400 | $0 | $0 |
| 2016 | $140 | $236,000 | $0 | $0 |
| 2015 | $3,294 | $227,800 | $0 | $0 |
| 2014 | $3,294 | $227,800 | $0 | $0 |
Source: Public Records
Map
Nearby Homes
- HOMESITE #18 341 Tumblers Way
- 345 Tumblers Way Unit 20
- 349 Tumblers Way Unit 22
- 1053 Flint Ct Unit 54
- 321 Tumblers Way
- 355 Tumblers Way
- 355 Tumblers Way Unit 25
- 391 Tumblers Way
- 353 Tumblers Way Unit 24
- 391 Tumblers Way Unit 41
- 395 Enfield Rd
- 415 Trimble Rd
- 304 Barksdale Rd
- 503 Eckhart Dr
- 1505 Mandeville Ln
- 222 Doncaster Rd
- 612 Baldwin Dr
- 1603 Bulls Ln
- Fulton Plan at Joppa Crossing
- 200 Chell Rd
- 304 Joppa Crossing Way
- 332 Enfield Rd
- 334 Enfield Rd
- 306 Joppa Crossing Way
- 0 Enfield Rd
- 321 Tumblers Way Unit 8
- 307 Joppa Crossing Way
- 303 Joppa Crossing Way
- 329 Tumblers Way
- 305 Joppa Crossing Way
- 309 Joppa Crossing Way
- 308 Joppa Crossing Way
- 331 Tumblers
- 331 Tumblers Unit 13
- 333 Tumblers Way
- 336 Enfield Rd
- 311 Joppa Crossing Way
- 330 Enfield Rd
- 1063 Flint Ct
- 310 Joppa Crossing Way