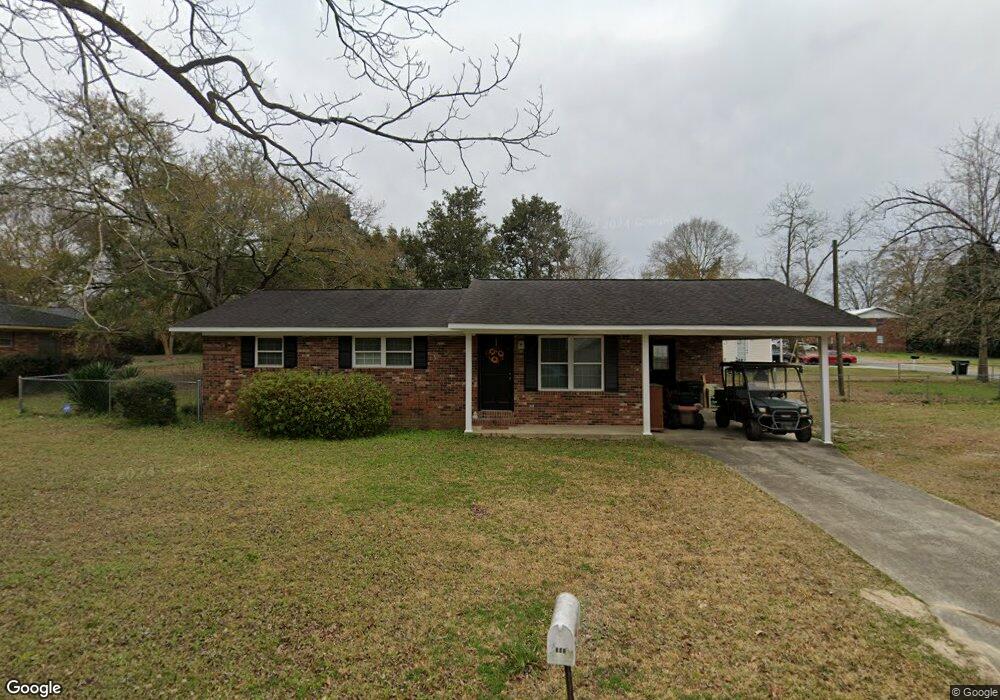
302 Kirkland Ave Glennville, GA 30427
Estimated Value: $129,202 - $150,000
3
Beds
2
Baths
1,107
Sq Ft
$124/Sq Ft
Est. Value
About This Home
This home is located at 302 Kirkland Ave, Glennville, GA 30427 and is currently estimated at $137,551, approximately $124 per square foot. 302 Kirkland Ave is a home located in Tattnall County with nearby schools including Tattnall County High School and Glennville Christian Academy.
Ownership History
Date
Name
Owned For
Owner Type
Purchase Details
Closed on
Dec 18, 2013
Sold by
Terrell Wayne
Bought by
Terrell Wayne and Terrell Deborah
Current Estimated Value
Purchase Details
Closed on
Jul 2, 2013
Sold by
Walker Cathy
Bought by
Jpmorgan Chase Bank National A
Purchase Details
Closed on
Feb 3, 2009
Sold by
Chase Home Finance Llc
Bought by
Secretary Of Veterans Affairs
Purchase Details
Closed on
Jul 31, 2007
Sold by
Graham Joy
Bought by
Hopkins John S and Hopkins Arlo
Home Financials for this Owner
Home Financials are based on the most recent Mortgage that was taken out on this home.
Original Mortgage
$80,613
Interest Rate
6.56%
Mortgage Type
VA
Purchase Details
Closed on
Apr 2, 2007
Sold by
G & C Homebuilders Inc
Bought by
Graham Joy
Purchase Details
Closed on
Oct 3, 2006
Sold by
Usda Rural Development
Bought by
G & C Homebuilders Inc
Purchase Details
Closed on
Feb 6, 1995
Bought by
Pinson Jannita J
Create a Home Valuation Report for This Property
The Home Valuation Report is an in-depth analysis detailing your home's value as well as a comparison with similar homes in the area
Home Values in the Area
Average Home Value in this Area
Purchase History
| Date | Buyer | Sale Price | Title Company |
|---|---|---|---|
| Terrell Wayne | -- | -- | |
| Terrell Wayne | $55,500 | -- | |
| Jpmorgan Chase Bank National A | $60,350 | -- | |
| Secretary Of Veterans Affairs | -- | -- | |
| Chase Home Finance Llc | -- | -- | |
| Hopkins John S | $78,000 | -- | |
| Graham Joy | -- | -- | |
| G & C Homebuilders Inc | -- | -- | |
| Pinson Jannita J | $46,500 | -- |
Source: Public Records
Mortgage History
| Date | Status | Borrower | Loan Amount |
|---|---|---|---|
| Previous Owner | Hopkins John S | $80,613 |
Source: Public Records
Tax History Compared to Growth
Tax History
| Year | Tax Paid | Tax Assessment Tax Assessment Total Assessment is a certain percentage of the fair market value that is determined by local assessors to be the total taxable value of land and additions on the property. | Land | Improvement |
|---|---|---|---|---|
| 2024 | $1,143 | $32,112 | $2,400 | $29,712 |
| 2023 | $1,143 | $32,112 | $2,400 | $29,712 |
| 2022 | $954 | $26,792 | $2,400 | $24,392 |
| 2021 | $867 | $24,928 | $2,400 | $22,528 |
| 2020 | $868 | $24,928 | $2,400 | $22,528 |
| 2019 | $907 | $25,408 | $2,200 | $23,208 |
| 2018 | $919 | $25,408 | $2,200 | $23,208 |
| 2017 | $704 | $25,408 | $2,200 | $23,208 |
| 2016 | $200 | $25,128 | $2,200 | $22,928 |
| 2015 | -- | $25,168 | $2,200 | $22,968 |
| 2014 | -- | $25,528 | $2,200 | $23,328 |
| 2013 | -- | $25,528 | $2,200 | $23,328 |
Source: Public Records
Map
Nearby Homes
- 203 N Tillman St
- 301 Kirkland Ave
- 304 Kirkland Ave
- 303 Kirkland Ave
- 305 Kirkland Ave
- 304 Marietta St
- 206 Henry St
- 206 N Henry St
- 304 N Henry St
- 201 N Tillman St
- 304 Henry St
- 301 Railroad St
- 301 1/2 Railroad St
- 204 Henry St
- 309 Marietta St
- 118 N Tillman St
- 1035 Henry St
- 305 Marietta St
- 301 Marietta St
- 303 Marietta St