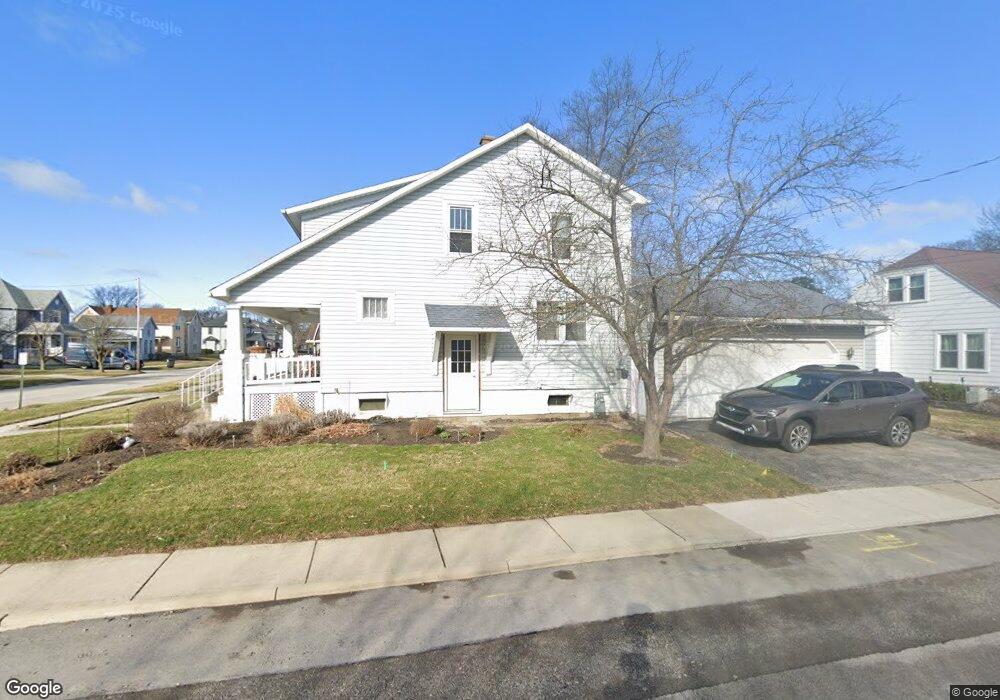
302 Locust St Findlay, OH 45840
Estimated Value: $180,170 - $192,000
3
Beds
2
Baths
1,400
Sq Ft
$133/Sq Ft
Est. Value
About This Home
This home is located at 302 Locust St, Findlay, OH 45840 and is currently estimated at $186,043, approximately $132 per square foot. 302 Locust St is a home located in Hancock County with nearby schools including Lincoln Elementary School, Donnell Middle School, and Findlay High School.
Ownership History
Date
Name
Owned For
Owner Type
Purchase Details
Closed on
Jan 20, 2004
Sold by
King Anthony M and King Sabriye S
Bought by
Hague Douglas E
Current Estimated Value
Home Financials for this Owner
Home Financials are based on the most recent Mortgage that was taken out on this home.
Original Mortgage
$110,500
Outstanding Balance
$52,928
Interest Rate
6.25%
Mortgage Type
Purchase Money Mortgage
Estimated Equity
$133,115
Purchase Details
Closed on
Oct 24, 1997
Sold by
Osborne Danny
Bought by
King Anthony and King Sabriye
Home Financials for this Owner
Home Financials are based on the most recent Mortgage that was taken out on this home.
Original Mortgage
$86,150
Interest Rate
7.65%
Mortgage Type
New Conventional
Purchase Details
Closed on
Jan 7, 1991
Bought by
Osborne Danny Donnell
Purchase Details
Closed on
Aug 20, 1990
Bought by
Stein Terry W
Purchase Details
Closed on
Oct 14, 1988
Bought by
Stein Terry W
Purchase Details
Closed on
Jan 4, 1984
Bought by
Radel Kert R and Radel Tamara L
Create a Home Valuation Report for This Property
The Home Valuation Report is an in-depth analysis detailing your home's value as well as a comparison with similar homes in the area
Home Values in the Area
Average Home Value in this Area
Purchase History
| Date | Buyer | Sale Price | Title Company |
|---|---|---|---|
| Hague Douglas E | $110,500 | -- | |
| King Anthony | $107,700 | -- | |
| Osborne Danny Donnell | $54,000 | -- | |
| Stein Terry W | -- | -- | |
| Stein Terry W | $51,900 | -- | |
| Radel Kert R | $36,000 | -- |
Source: Public Records
Mortgage History
| Date | Status | Borrower | Loan Amount |
|---|---|---|---|
| Open | Hague Douglas E | $110,500 | |
| Previous Owner | King Anthony | $86,150 |
Source: Public Records
Tax History Compared to Growth
Tax History
| Year | Tax Paid | Tax Assessment Tax Assessment Total Assessment is a certain percentage of the fair market value that is determined by local assessors to be the total taxable value of land and additions on the property. | Land | Improvement |
|---|---|---|---|---|
| 2024 | $1,372 | $38,630 | $5,500 | $33,130 |
| 2023 | $1,374 | $38,630 | $5,500 | $33,130 |
| 2022 | $1,370 | $38,630 | $5,500 | $33,130 |
| 2021 | $1,285 | $31,570 | $5,640 | $25,930 |
| 2020 | $1,285 | $31,570 | $5,640 | $25,930 |
| 2019 | $1,259 | $31,570 | $5,640 | $25,930 |
| 2018 | $1,172 | $26,920 | $3,970 | $22,950 |
| 2017 | $585 | $26,920 | $3,970 | $22,950 |
| 2016 | $1,150 | $26,640 | $3,970 | $22,670 |
| 2015 | $966 | $22,100 | $3,970 | $18,130 |
| 2014 | $966 | $22,100 | $3,970 | $18,130 |
| 2012 | $872 | $19,740 | $3,970 | $15,770 |
Source: Public Records
Map
Nearby Homes