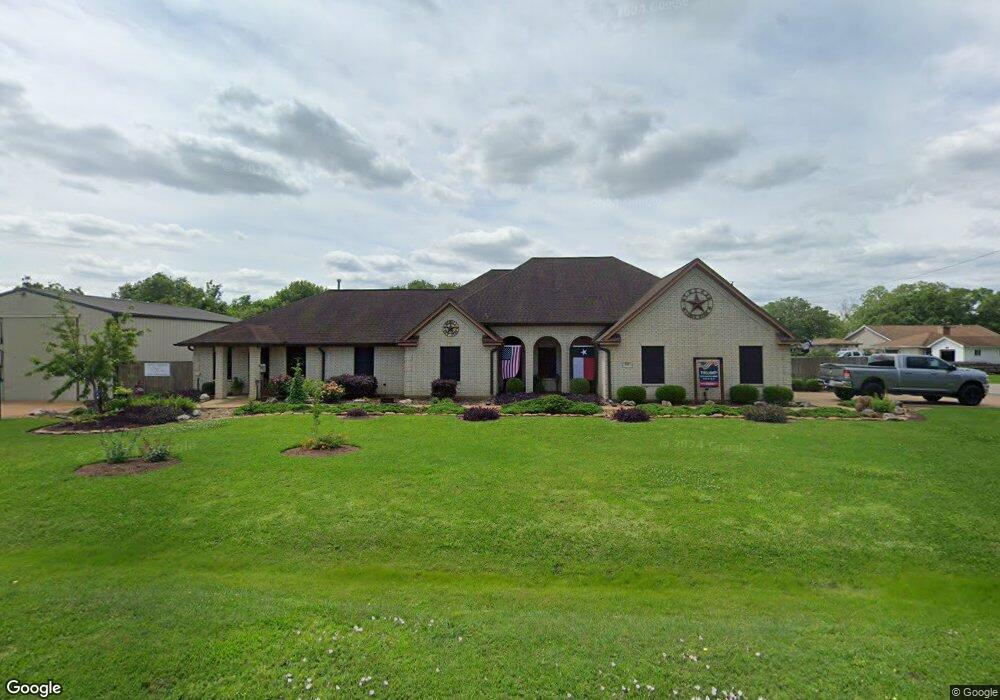
302 Magnolia St Brazoria, TX 77422
Estimated Value: $282,000 - $366,000
3
Beds
3
Baths
2,040
Sq Ft
$154/Sq Ft
Est. Value
About This Home
This home is located at 302 Magnolia St, Brazoria, TX 77422 and is currently estimated at $315,046, approximately $154 per square foot. 302 Magnolia St is a home located in Brazoria County.
Ownership History
Date
Name
Owned For
Owner Type
Purchase Details
Closed on
Sep 28, 2007
Sold by
Flannel Marvin R
Bought by
Newell Rodney
Current Estimated Value
Home Financials for this Owner
Home Financials are based on the most recent Mortgage that was taken out on this home.
Original Mortgage
$119,850
Outstanding Balance
$76,575
Interest Rate
6.66%
Mortgage Type
Purchase Money Mortgage
Estimated Equity
$238,471
Purchase Details
Closed on
Jun 3, 2005
Sold by
Martin Justin and Martin Angela
Bought by
Flannel Marvin R
Home Financials for this Owner
Home Financials are based on the most recent Mortgage that was taken out on this home.
Original Mortgage
$157,000
Interest Rate
5.79%
Mortgage Type
Purchase Money Mortgage
Purchase Details
Closed on
Jul 22, 2004
Sold by
Parmlee Glenn
Bought by
Martin Justin and Martin Angela
Purchase Details
Closed on
Jun 13, 2001
Sold by
Martin Michael R and Martin Cynthia D
Bought by
Parmlee Glenn
Purchase Details
Closed on
Jun 26, 1996
Sold by
Chevalier Edwin K and Chevalier Felicia F
Bought by
Martin Michael R and Martin Cynthia D
Create a Home Valuation Report for This Property
The Home Valuation Report is an in-depth analysis detailing your home's value as well as a comparison with similar homes in the area
Home Values in the Area
Average Home Value in this Area
Purchase History
| Date | Buyer | Sale Price | Title Company |
|---|---|---|---|
| Newell Rodney | -- | Alamo Title Company | |
| Flannel Marvin R | -- | Alamo Title Company | |
| Martin Justin | -- | Alamo Title Company | |
| Parmlee Glenn | -- | Alamo Title 03 | |
| Martin Michael R | -- | -- |
Source: Public Records
Mortgage History
| Date | Status | Borrower | Loan Amount |
|---|---|---|---|
| Open | Newell Rodney | $119,850 | |
| Previous Owner | Flannel Marvin R | $157,000 |
Source: Public Records
Tax History Compared to Growth
Tax History
| Year | Tax Paid | Tax Assessment Tax Assessment Total Assessment is a certain percentage of the fair market value that is determined by local assessors to be the total taxable value of land and additions on the property. | Land | Improvement |
|---|---|---|---|---|
| 2025 | $4,848 | $316,580 | $49,940 | $266,640 |
| 2023 | $4,848 | $310,250 | $47,440 | $262,810 |
| 2022 | $6,574 | $291,030 | $41,860 | $249,170 |
| 2021 | $6,377 | $281,800 | $40,320 | $241,480 |
| 2020 | $6,061 | $245,000 | $37,210 | $207,790 |
| 2019 | $6,637 | $260,000 | $31,020 | $228,980 |
| 2018 | $6,311 | $245,880 | $35,190 | $210,690 |
| 2017 | $6,050 | $240,390 | $16,970 | $223,420 |
| 2016 | $5,521 | $227,850 | $14,140 | $213,710 |
| 2015 | $5,090 | $213,810 | $14,140 | $199,670 |
| 2014 | $5,090 | $210,970 | $14,140 | $196,830 |
Source: Public Records
Map
Nearby Homes
- 409 Carlton St
- 232 Magnolia St
- 0 Pecan Dr
- 229 Yaupon Dr
- 706 E New York St
- 523 Lazy Ln
- 549 E New York St
- 230 E New York St
- 307 Avenue G
- 4773 County Road 652
- 1208 S Brooks St
- 34654 Fm 521 Rd
- 8922 Fm 521 Rd
- 310 E Texas St
- 401 E Texas St
- 206 S Market St
- 0 Cr-747a
- TBD Cr-318
- 320 Cr-320
- 0 Cr-318 Unit 18304666