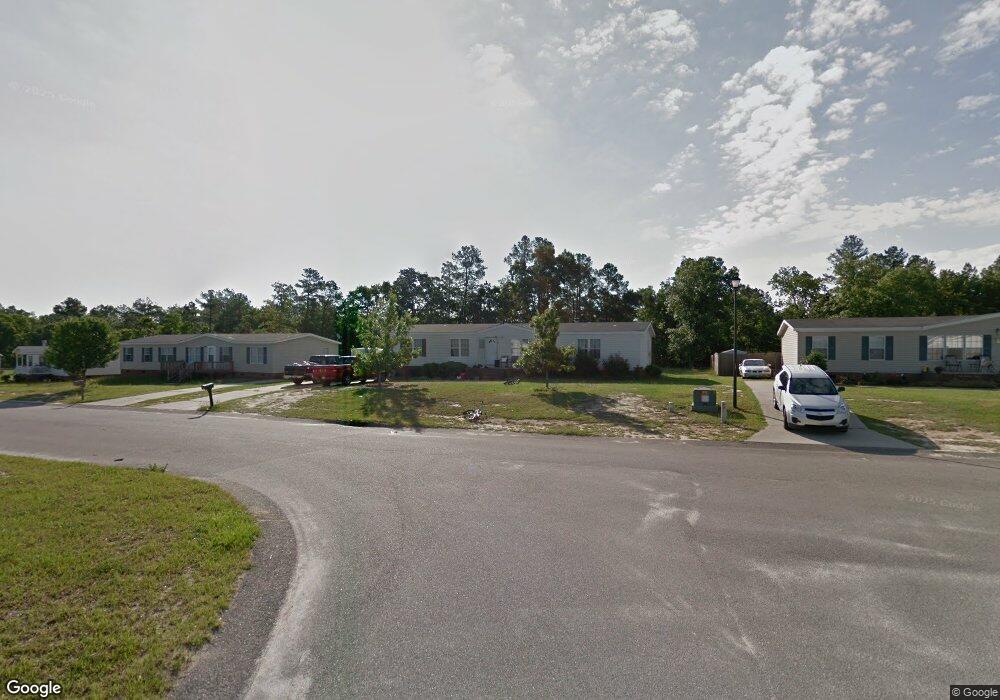
302 Manning Rd Raeford, NC 28376
Estimated Value: $166,000 - $222,000
3
Beds
2
Baths
1,850
Sq Ft
$101/Sq Ft
Est. Value
About This Home
This home is located at 302 Manning Rd, Raeford, NC 28376 and is currently estimated at $187,000, approximately $101 per square foot. 302 Manning Rd is a home located in Hoke County with nearby schools including Sandy Grove Elementary School, Sandy Grove Middle School, and Hoke County High.
Ownership History
Date
Name
Owned For
Owner Type
Purchase Details
Closed on
Aug 27, 2013
Sold by
The Secretary Of Veterans Affairs
Bought by
Isham Sanford
Current Estimated Value
Purchase Details
Closed on
Mar 12, 2013
Sold by
Perry Brian D and Perry Lori Ann
Bought by
Secretary Of Veterans Affairs
Purchase Details
Closed on
Mar 17, 2008
Sold by
Burnette Kevin L and Burnette Shannon M
Bought by
Perry Brian David and Perry Lori Ann
Home Financials for this Owner
Home Financials are based on the most recent Mortgage that was taken out on this home.
Original Mortgage
$84,250
Interest Rate
6.22%
Mortgage Type
VA
Create a Home Valuation Report for This Property
The Home Valuation Report is an in-depth analysis detailing your home's value as well as a comparison with similar homes in the area
Home Values in the Area
Average Home Value in this Area
Purchase History
| Date | Buyer | Sale Price | Title Company |
|---|---|---|---|
| Isham Sanford | -- | None Available | |
| Secretary Of Veterans Affairs | $51,115 | None Available | |
| Perry Brian David | $82,000 | None Available |
Source: Public Records
Mortgage History
| Date | Status | Borrower | Loan Amount |
|---|---|---|---|
| Previous Owner | Perry Brian David | $84,250 |
Source: Public Records
Tax History Compared to Growth
Tax History
| Year | Tax Paid | Tax Assessment Tax Assessment Total Assessment is a certain percentage of the fair market value that is determined by local assessors to be the total taxable value of land and additions on the property. | Land | Improvement |
|---|---|---|---|---|
| 2024 | $939 | $98,660 | $22,500 | $76,160 |
| 2023 | $939 | $98,660 | $22,500 | $76,160 |
| 2022 | $0 | $98,660 | $22,500 | $76,160 |
| 2021 | $0 | $87,490 | $22,500 | $64,990 |
| 2020 | $863 | $87,490 | $22,500 | $64,990 |
| 2019 | $863 | $87,490 | $22,500 | $64,990 |
| 2018 | $863 | $87,490 | $22,500 | $64,990 |
| 2017 | $848 | $87,490 | $22,500 | $64,990 |
| 2016 | $848 | $87,490 | $22,500 | $64,990 |
| 2015 | $848 | $87,490 | $22,500 | $64,990 |
| 2014 | $827 | $87,490 | $22,500 | $64,990 |
| 2013 | -- | $92,250 | $21,000 | $71,250 |
Source: Public Records
Map
Nearby Homes