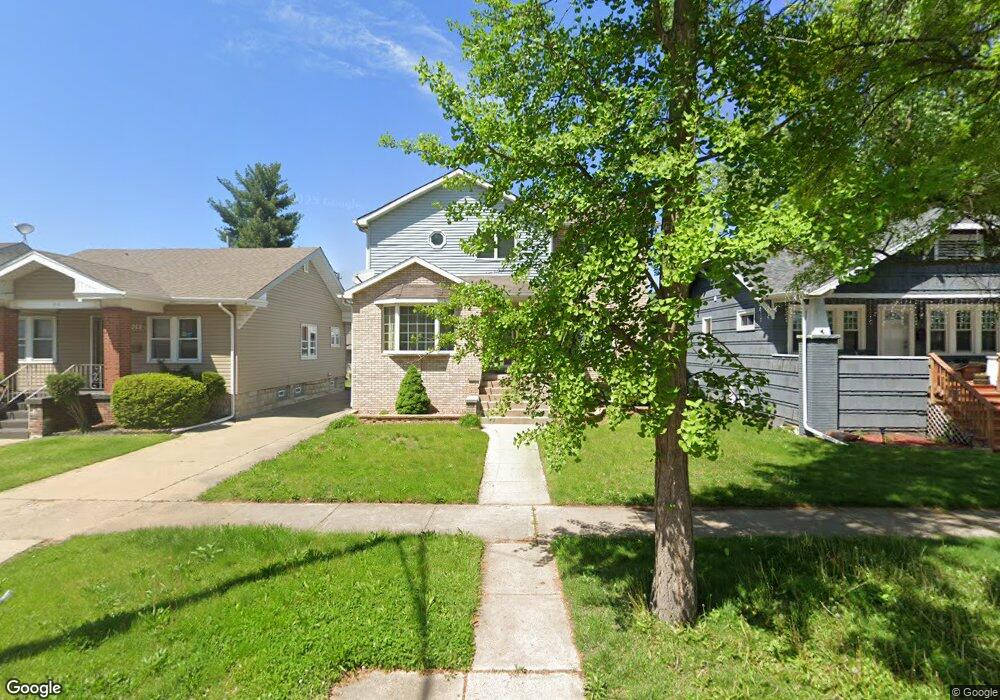
302 Mason St Calumet City, IL 60409
Estimated Value: $210,756 - $244,000
3
Beds
2
Baths
1,604
Sq Ft
$146/Sq Ft
Est. Value
About This Home
This home is located at 302 Mason St, Calumet City, IL 60409 and is currently estimated at $233,439, approximately $145 per square foot. 302 Mason St is a home located in Cook County with nearby schools including Lincoln Elementary School, Thornton Fractional North High School, and Hammond Academy Of Science & Tech.
Ownership History
Date
Name
Owned For
Owner Type
Purchase Details
Closed on
Jul 3, 2001
Sold by
Saitta Patrice L
Bought by
Boadjo Yaa
Current Estimated Value
Home Financials for this Owner
Home Financials are based on the most recent Mortgage that was taken out on this home.
Original Mortgage
$147,584
Interest Rate
7.11%
Mortgage Type
FHA
Purchase Details
Closed on
Oct 21, 1999
Sold by
Saitta David A
Bought by
Saitta Patrice L
Purchase Details
Closed on
Nov 14, 1996
Sold by
Saitta David
Bought by
Vantuyl Saitta Patrice
Create a Home Valuation Report for This Property
The Home Valuation Report is an in-depth analysis detailing your home's value as well as a comparison with similar homes in the area
Home Values in the Area
Average Home Value in this Area
Purchase History
| Date | Buyer | Sale Price | Title Company |
|---|---|---|---|
| Boadjo Yaa | $150,000 | -- | |
| Saitta Patrice L | -- | -- | |
| Vantuyl Saitta Patrice | -- | -- |
Source: Public Records
Mortgage History
| Date | Status | Borrower | Loan Amount |
|---|---|---|---|
| Previous Owner | Boadjo Yaa | $147,584 |
Source: Public Records
Tax History Compared to Growth
Tax History
| Year | Tax Paid | Tax Assessment Tax Assessment Total Assessment is a certain percentage of the fair market value that is determined by local assessors to be the total taxable value of land and additions on the property. | Land | Improvement |
|---|---|---|---|---|
| 2024 | $6,463 | $15,000 | $1,872 | $13,128 |
| 2023 | $5,163 | $15,000 | $1,872 | $13,128 |
| 2022 | $5,163 | $10,551 | $1,638 | $8,913 |
| 2021 | $5,334 | $10,551 | $1,638 | $8,913 |
| 2020 | $5,131 | $10,551 | $1,638 | $8,913 |
| 2019 | $6,219 | $12,031 | $1,521 | $10,510 |
| 2018 | $6,125 | $12,031 | $1,521 | $10,510 |
| 2017 | $5,943 | $12,031 | $1,521 | $10,510 |
| 2016 | $5,806 | $11,475 | $1,404 | $10,071 |
| 2015 | $5,525 | $11,475 | $1,404 | $10,071 |
| 2014 | $5,554 | $11,475 | $1,404 | $10,071 |
| 2013 | $5,548 | $12,424 | $1,404 | $11,020 |
Source: Public Records
Map
Nearby Homes