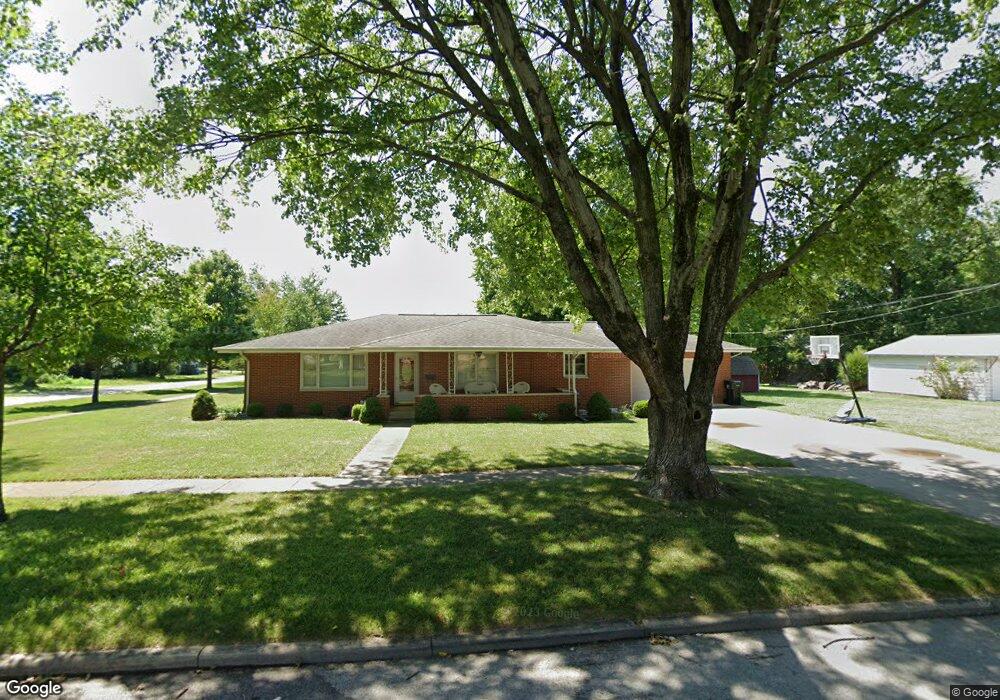
302 N 5th St Marshall, IL 62441
Estimated Value: $143,612 - $231,000
3
Beds
1
Bath
1,595
Sq Ft
$116/Sq Ft
Est. Value
About This Home
This home is located at 302 N 5th St, Marshall, IL 62441 and is currently estimated at $184,903, approximately $115 per square foot. 302 N 5th St is a home located in Clark County with nearby schools including South Elementary School, North Elementary School, and Marshall Junior High School.
Ownership History
Date
Name
Owned For
Owner Type
Purchase Details
Closed on
Apr 26, 2010
Sold by
Perisho Dean S and Parisho Dean S
Bought by
Parsons Richard A and Parsons Paula L
Current Estimated Value
Home Financials for this Owner
Home Financials are based on the most recent Mortgage that was taken out on this home.
Original Mortgage
$96,000
Interest Rate
6.5%
Mortgage Type
Purchase Money Mortgage
Purchase Details
Closed on
Jul 6, 2007
Sold by
Livengood Heather
Bought by
Perisho Dean and Perisho June R
Home Financials for this Owner
Home Financials are based on the most recent Mortgage that was taken out on this home.
Original Mortgage
$60,000
Interest Rate
6%
Mortgage Type
Adjustable Rate Mortgage/ARM
Purchase Details
Closed on
Apr 22, 2005
Sold by
Ruks Janis and Barrett Bob
Bought by
Livengood Heather
Home Financials for this Owner
Home Financials are based on the most recent Mortgage that was taken out on this home.
Original Mortgage
$88,500
Interest Rate
6.13%
Mortgage Type
New Conventional
Create a Home Valuation Report for This Property
The Home Valuation Report is an in-depth analysis detailing your home's value as well as a comparison with similar homes in the area
Home Values in the Area
Average Home Value in this Area
Purchase History
| Date | Buyer | Sale Price | Title Company |
|---|---|---|---|
| Parsons Richard A | $101,500 | None Available | |
| Perisho Dean | -- | None Available | |
| Livengood Heather | $88,500 | None Available |
Source: Public Records
Mortgage History
| Date | Status | Borrower | Loan Amount |
|---|---|---|---|
| Closed | Parsons Richard A | $96,000 | |
| Previous Owner | Perisho Dean | $60,000 | |
| Previous Owner | Livengood Heather | $88,500 |
Source: Public Records
Tax History Compared to Growth
Tax History
| Year | Tax Paid | Tax Assessment Tax Assessment Total Assessment is a certain percentage of the fair market value that is determined by local assessors to be the total taxable value of land and additions on the property. | Land | Improvement |
|---|---|---|---|---|
| 2024 | $2,370 | $42,154 | $5,447 | $36,707 |
| 2023 | $2,322 | $42,154 | $5,447 | $36,707 |
| 2022 | $2,206 | $37,637 | $4,863 | $32,774 |
| 2021 | $2,190 | $35,175 | $4,545 | $30,630 |
| 2020 | $2,178 | $35,175 | $4,545 | $30,630 |
| 2019 | $2,178 | $35,175 | $4,545 | $30,630 |
| 2018 | $2,232 | $35,175 | $4,545 | $30,630 |
| 2017 | $2,256 | $35,973 | $4,648 | $31,325 |
| 2016 | $2,331 | $35,175 | $4,545 | $30,630 |
| 2015 | $2,158 | $33,735 | $4,670 | $29,065 |
| 2014 | $2,040 | $32,835 | $4,545 | $28,290 |
| 2013 | $2,040 | $31,745 | $4,390 | $27,355 |
Source: Public Records
Map
Nearby Homes
- 202 S 4th St
- 315 S 5th St
- 1014 Plum St
- 1204 Beech St
- 302 Elm St
- 812 S 4th St
- 107 Linden St
- 211 Brush Creek Dr
- 17383 N Hummingbird Ln
- 103 Kyden Dr
- 10 Rose Ln
- 104 Thomas Dr
- 104 Woodland Dr
- 19996 N 2250th St
- 20575 N Edgewater Ct
- 0 Crooked Ln Unit Lot WP001 24435818
- 11586 E Clarksville Rd
- 10086 E 1500th Rd
- 12043 E 2170th Rd
- 0 N 1020th St