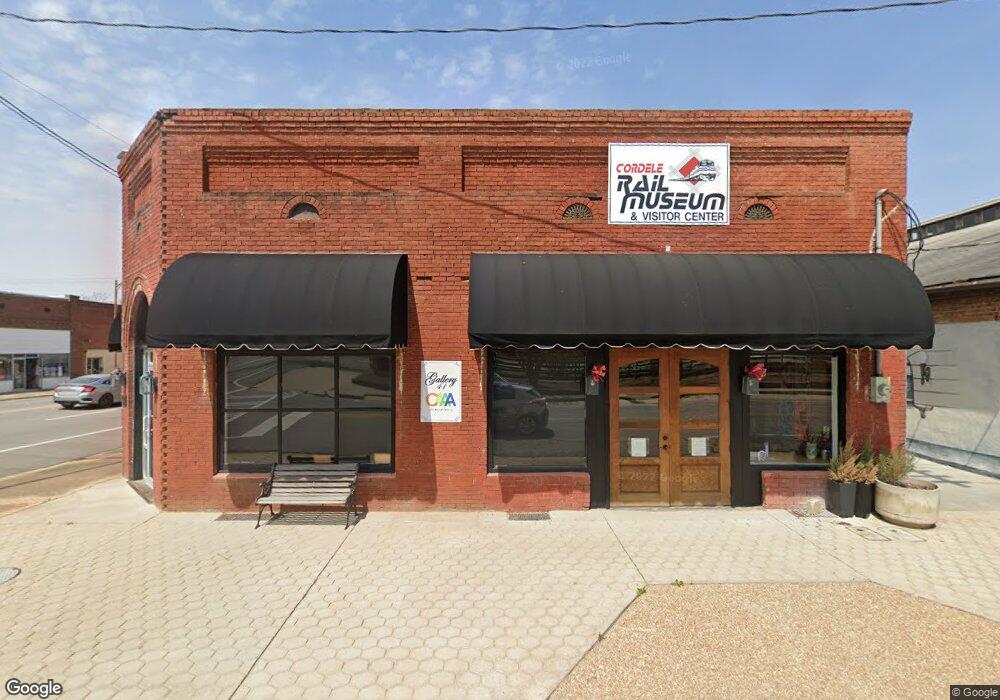
302 N 7th St Cordele, GA 31015
Estimated Value: $61,085
--
Bed
--
Bath
2,800
Sq Ft
$22/Sq Ft
Est. Value
About This Home
This home is located at 302 N 7th St, Cordele, GA 31015 and is currently estimated at $61,085, approximately $21 per square foot. 302 N 7th St is a home located in Crisp County with nearby schools including Crisp County Elementary School, Crisp County Primary School, and Crisp County Middle School.
Ownership History
Date
Name
Owned For
Owner Type
Purchase Details
Closed on
Oct 16, 2014
Sold by
Apperson Michael C
Bought by
Downtown Development Authority
Current Estimated Value
Purchase Details
Closed on
Sep 27, 2006
Sold by
Apperson James C
Bought by
Apperson Michael C and Apperson Sandra
Purchase Details
Closed on
Sep 24, 2006
Sold by
Apperson Kenneth C
Bought by
Apperson James C
Purchase Details
Closed on
Dec 1, 2005
Sold by
Apperson James C
Bought by
Apperson Kenneth C
Home Financials for this Owner
Home Financials are based on the most recent Mortgage that was taken out on this home.
Original Mortgage
$75,000
Interest Rate
6.23%
Mortgage Type
Commercial
Purchase Details
Closed on
Jan 21, 1993
Bought by
Apperson James
Purchase Details
Closed on
Aug 24, 1992
Bought by
Apperson James
Purchase Details
Closed on
May 28, 1991
Bought by
Bank Of Dooly
Create a Home Valuation Report for This Property
The Home Valuation Report is an in-depth analysis detailing your home's value as well as a comparison with similar homes in the area
Home Values in the Area
Average Home Value in this Area
Purchase History
| Date | Buyer | Sale Price | Title Company |
|---|---|---|---|
| Downtown Development Authority | $25,000 | -- | |
| Apperson Michael C | -- | -- | |
| Apperson James C | -- | -- | |
| Apperson Kenneth C | $75,000 | -- | |
| Apperson James | $500 | -- | |
| Apperson James | -- | -- | |
| Bank Of Dooly | -- | -- |
Source: Public Records
Mortgage History
| Date | Status | Borrower | Loan Amount |
|---|---|---|---|
| Previous Owner | Apperson Kenneth C | $75,000 |
Source: Public Records
Tax History Compared to Growth
Tax History
| Year | Tax Paid | Tax Assessment Tax Assessment Total Assessment is a certain percentage of the fair market value that is determined by local assessors to be the total taxable value of land and additions on the property. | Land | Improvement |
|---|---|---|---|---|
| 2025 | -- | $12,622 | $378 | $12,244 |
| 2024 | -- | $12,622 | $378 | $12,244 |
| 2023 | $493 | $12,622 | $378 | $12,244 |
| 2022 | $493 | $12,622 | $378 | $12,244 |
| 2021 | $493 | $12,622 | $378 | $12,244 |
| 2020 | $513 | $12,622 | $378 | $12,244 |
| 2019 | $513 | $12,622 | $378 | $12,244 |
| 2018 | $718 | $17,674 | $858 | $16,816 |
| 2017 | $718 | $17,674 | $858 | $16,816 |
| 2016 | $718 | $17,674 | $858 | $16,816 |
| 2015 | -- | $17,674 | $858 | $16,816 |
| 2014 | -- | $17,674 | $858 | $16,816 |
| 2013 | -- | $17,674 | $858 | $16,816 |
Source: Public Records
Map
Nearby Homes
- 103 9th Ave E
- 109 9th Ave E
- 2298(PP) S Ga Hwy 41
- ooo Mobile Dr Jenkins Rd
- BB Wolf's Thick Rd
- 303 N 7th St
- E E 8th Ave
- 309 7th St N
- 309 N 7th St
- tbd Lot 7 On Laporte Dr
- 109 N 7th St
- 102 N 7th St
- 114 W 11th Ave
- 2 Ga-90
- 201 E 11th Ave
- 701 E 17th Ave Cordele
- 210 E 11th Ave
- 111 W 11th Ave
- 205 11th Ave E
- 116 E 11th Ave