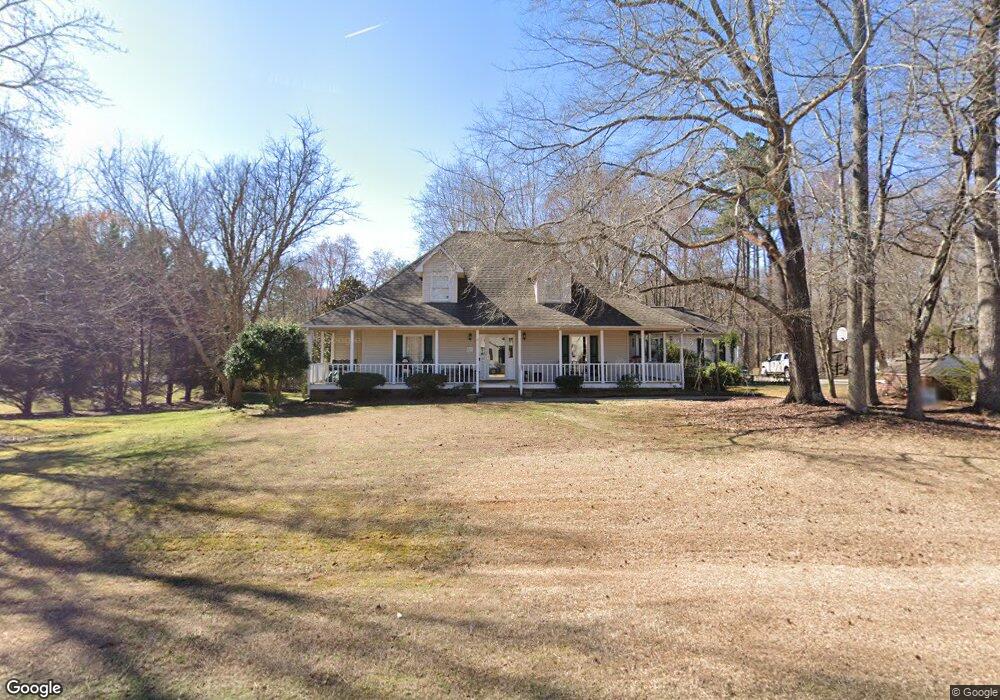
302 N Deerfield Cir Salisbury, NC 28147
Estimated Value: $371,003 - $468,000
3
Beds
3
Baths
2,357
Sq Ft
$177/Sq Ft
Est. Value
About This Home
This home is located at 302 N Deerfield Cir, Salisbury, NC 28147 and is currently estimated at $416,751, approximately $176 per square foot. 302 N Deerfield Cir is a home located in Rowan County with nearby schools including North Rowan Elementary School, North Rowan Middle School, and North Rowan High School.
Ownership History
Date
Name
Owned For
Owner Type
Purchase Details
Closed on
Sep 26, 2022
Sold by
Maxon Brenda E
Bought by
Brown Clyde A and Brown Brenda E
Current Estimated Value
Home Financials for this Owner
Home Financials are based on the most recent Mortgage that was taken out on this home.
Original Mortgage
$502,500
Outstanding Balance
$500,812
Interest Rate
5.13%
Mortgage Type
Credit Line Revolving
Estimated Equity
-$84,061
Purchase Details
Closed on
Sep 29, 2005
Sold by
Maxon Joseph A
Bought by
Maxon Brenda E
Purchase Details
Closed on
Aug 3, 2004
Sold by
Laurens James M and Laurens Anelia H
Bought by
Maxon Joseph A and Maxon Brenda E
Home Financials for this Owner
Home Financials are based on the most recent Mortgage that was taken out on this home.
Original Mortgage
$130,000
Interest Rate
6.24%
Mortgage Type
Purchase Money Mortgage
Create a Home Valuation Report for This Property
The Home Valuation Report is an in-depth analysis detailing your home's value as well as a comparison with similar homes in the area
Home Values in the Area
Average Home Value in this Area
Purchase History
| Date | Buyer | Sale Price | Title Company |
|---|---|---|---|
| Brown Clyde A | $13,000 | Fnc Title | |
| Maxon Brenda E | -- | -- | |
| Maxon Joseph A | $189,000 | -- |
Source: Public Records
Mortgage History
| Date | Status | Borrower | Loan Amount |
|---|---|---|---|
| Open | Brown Clyde A | $502,500 | |
| Previous Owner | Maxon Joseph A | $130,000 | |
| Closed | Brown Clyde A | $502,500 |
Source: Public Records
Tax History Compared to Growth
Tax History
| Year | Tax Paid | Tax Assessment Tax Assessment Total Assessment is a certain percentage of the fair market value that is determined by local assessors to be the total taxable value of land and additions on the property. | Land | Improvement |
|---|---|---|---|---|
| 2025 | $2,199 | $328,282 | $38,000 | $290,282 |
| 2024 | $2,199 | $328,282 | $38,000 | $290,282 |
| 2023 | $1,227 | $328,282 | $38,000 | $290,282 |
| 2022 | $987 | $229,133 | $35,000 | $194,133 |
| 2021 | $1,671 | $229,133 | $35,000 | $194,133 |
| 2020 | $1,671 | $229,133 | $35,000 | $194,133 |
| 2019 | $1,671 | $229,133 | $35,000 | $194,133 |
| 2018 | $1,428 | $197,446 | $35,000 | $162,446 |
| 2017 | $1,428 | $197,446 | $35,000 | $162,446 |
| 2016 | $1,428 | $197,446 | $35,000 | $162,446 |
| 2015 | $1,449 | $197,446 | $35,000 | $162,446 |
| 2014 | $1,408 | $195,600 | $35,000 | $160,600 |
Source: Public Records
Map
Nearby Homes
- 204 S Deerfield Cir
- 335 Young Rd
- 1206 Archer Farm Dr
- 175 Country Ln
- 114 Wedgefield Dr
- 720 Potneck Rd
- 4100 Hampton Rd
- 510 Newport Dr
- 0 Long Bow Rd Unit CAR4268967
- 0 Rock Springs Dr Unit CAR4261106
- 1005 Spring Meadow Dr
- 5020 Old Mocksville Rd
- 0 Elizabeth Ave Unit 48-49 CAR4299122
- 4355 Franklin Community Center Rd
- 450 E Ridge Rd Unit 17-18
- 1207 + River Trace Ln Unit 9,15-19,21&21
- 2855 Gheen Rd
- 270 North St
- 250 Timber Ridge Dr
- 477 Old Tulip Farm Rd
- 304 N Deerfield Cir
- 301 N Deerfield Cir
- 303 N Deerfield Cir
- 303 N Deerfield Cir Unit 55
- 306 N Deerfield Cir
- 6312 Elk Trail
- 305 N Deerfield Cir
- 206 N Deerfield Cir
- 205 N Deerfield Cir
- 6313 Elk Trail
- 6311 Elk Trail
- 307 N Deerfield Cir
- 308 N Deerfield Cir
- 6310 Elk Trail
- 309 N Deerfield Cir
- 310 N Deerfield Cir
- 6402 Fox Trace
- 311 N Deerfield Cir
- 7055 Us Highway 601
- 7055 Us Highway 601