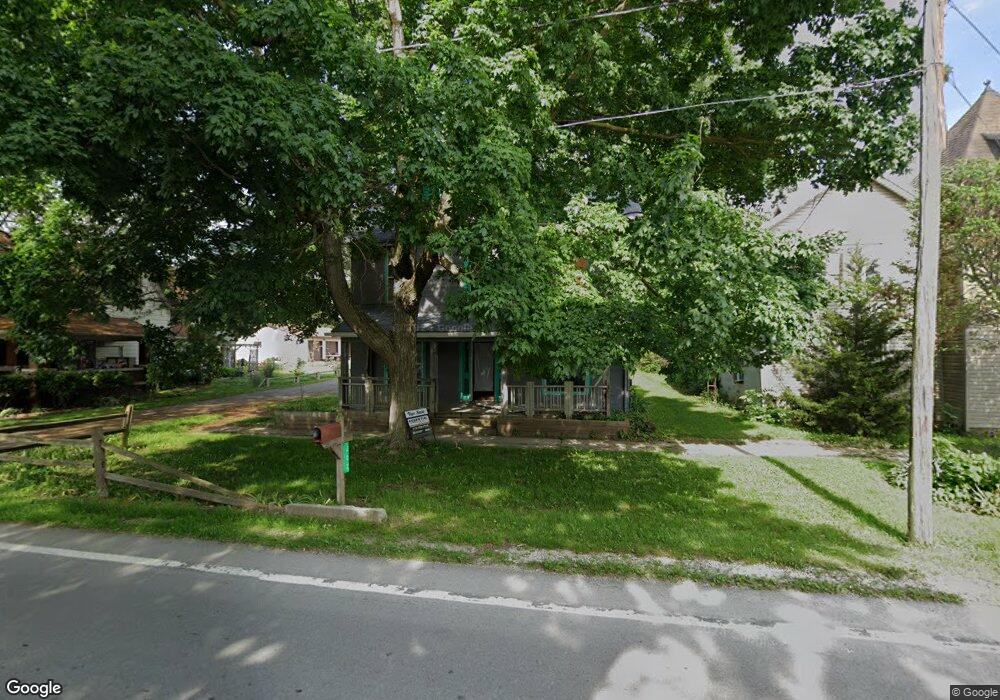
302 N Main St Nevada, OH 44849
Estimated Value: $55,000 - $165,000
5
Beds
2
Baths
2,048
Sq Ft
$46/Sq Ft
Est. Value
About This Home
This home is located at 302 N Main St, Nevada, OH 44849 and is currently estimated at $93,480, approximately $45 per square foot. 302 N Main St is a home located in Wyandot County with nearby schools including Wynford Elementary School and Wynford High School.
Ownership History
Date
Name
Owned For
Owner Type
Purchase Details
Closed on
Jan 11, 2025
Sold by
Huckaba Amy Sue
Bought by
Smith Earl T and Flack Richard
Current Estimated Value
Purchase Details
Closed on
Aug 13, 2024
Sold by
Dsv Spv1 Llc
Bought by
Huckaba Amy Sue
Purchase Details
Closed on
Jul 18, 2017
Sold by
Kaja Holdings Llc
Bought by
Dsv Spv1 Llc
Purchase Details
Closed on
Feb 21, 2013
Sold by
Federal National Mortgage Association
Bought by
Kaja Holdings Llc
Purchase Details
Closed on
Sep 27, 2012
Sold by
Smith Rebecca K and The Huntington National Bank
Bought by
Federal National Mortgage Association
Purchase Details
Closed on
Mar 4, 2005
Sold by
Cole Douglas A and Cole Lynda S
Bought by
Smith Rebecca K
Home Financials for this Owner
Home Financials are based on the most recent Mortgage that was taken out on this home.
Original Mortgage
$67,450
Interest Rate
5.71%
Purchase Details
Closed on
Aug 13, 2003
Bought by
Kaja Holdings Llc
Create a Home Valuation Report for This Property
The Home Valuation Report is an in-depth analysis detailing your home's value as well as a comparison with similar homes in the area
Purchase History
| Date | Buyer | Sale Price | Title Company |
|---|---|---|---|
| Smith Earl T | $42,400 | None Listed On Document | |
| Huckaba Amy Sue | $14,500 | Title Clearing | |
| Dsv Spv1 Llc | $8,350 | None Available | |
| Kaja Holdings Llc | $8,350 | Servicelink | |
| Federal National Mortgage Association | $11,000 | None Available | |
| Smith Rebecca K | $71,000 | None Available | |
| Kaja Holdings Llc | $8,400 | -- | |
| Kaja Holdings Llc | $8,400 | -- |
Source: Public Records
Mortgage History
| Date | Status | Borrower | Loan Amount |
|---|---|---|---|
| Previous Owner | Smith Rebecca K | $67,450 |
Source: Public Records
Tax History
| Year | Tax Paid | Tax Assessment Tax Assessment Total Assessment is a certain percentage of the fair market value that is determined by local assessors to be the total taxable value of land and additions on the property. | Land | Improvement |
|---|---|---|---|---|
| 2025 | $983 | $26,100 | $2,810 | $23,290 |
| 2024 | $826 | $20,650 | $2,290 | $18,360 |
| 2023 | $826 | $20,650 | $2,290 | $18,360 |
| 2022 | $929 | $20,650 | $2,290 | $18,360 |
| 2021 | $990 | $20,650 | $2,290 | $18,360 |
| 2020 | $973 | $20,650 | $2,290 | $18,360 |
| 2019 | $889 | $20,650 | $2,290 | $18,360 |
| 2018 | $816 | $18,700 | $2,060 | $16,640 |
| 2017 | $813 | $18,700 | $2,060 | $16,640 |
| 2016 | -- | $18,700 | $2,060 | $16,640 |
| 2015 | -- | $18,550 | $2,060 | $16,490 |
| 2014 | -- | $18,550 | $2,060 | $16,490 |
| 2013 | -- | $18,550 | $2,060 | $16,490 |
Source: Public Records
Map
Nearby Homes
- 200 S Garrett St
- 308 N Garrett St
- 419 N Goodbread St
- 11700 Township Highway 133
- 308 Lincoln Hwy
- 0 Us 30 & Sr 23
- 0 E Wyandot Ave
- 0 County Highway 121
- 212 Duck Pond Rd
- 2285 Shafer Rd
- 101 Rivers Edge Ln
- 7160 County Highway 47
- 275 Brentwood St
- 123 Rivers Edge Ln
- 105 Old Lincoln Hwy
- 1123 Hillcrest Dr
- 0 Highway 30
- 1149 Farmview Dr
- 4565 State Route 19
- 885 W Perry St
Your Personal Tour Guide
Ask me questions while you tour the home.