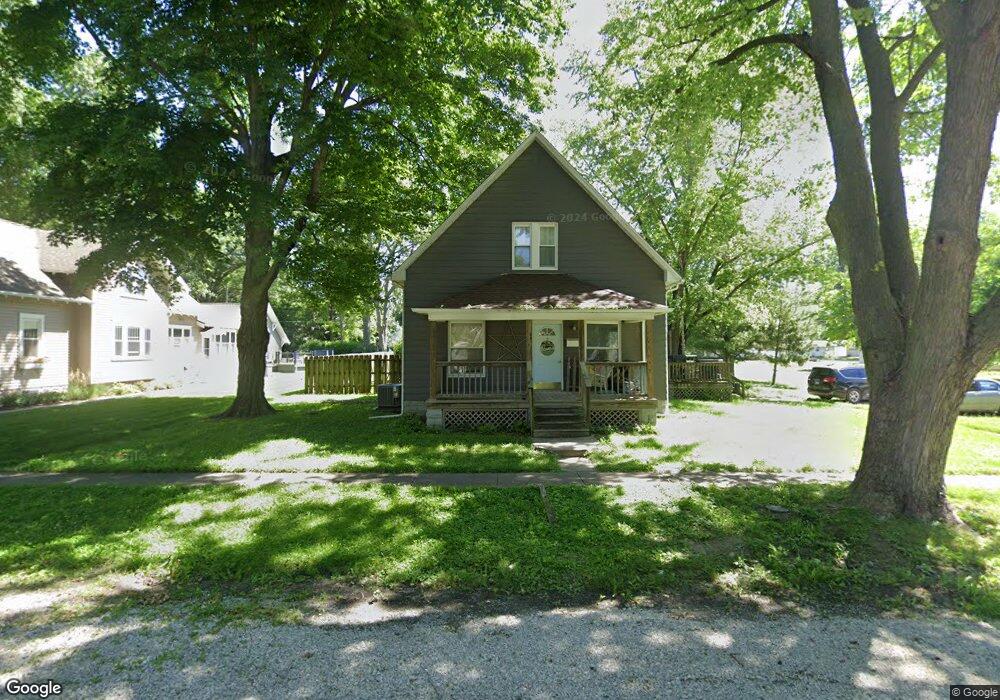
302 N Maple St Nokomis, IL 62075
Estimated Value: $72,000 - $124,000
--
Bed
--
Bath
948
Sq Ft
$108/Sq Ft
Est. Value
About This Home
This home is located at 302 N Maple St, Nokomis, IL 62075 and is currently estimated at $102,720, approximately $108 per square foot. 302 N Maple St is a home located in Montgomery County with nearby schools including North Elementary School, Nokomis Junior/Senior High School, and St. Louis Catholic School.
Ownership History
Date
Name
Owned For
Owner Type
Purchase Details
Closed on
Jan 28, 2017
Sold by
Foster Michael and Lawhorn Erin M
Bought by
Foster Michael
Current Estimated Value
Home Financials for this Owner
Home Financials are based on the most recent Mortgage that was taken out on this home.
Original Mortgage
$61,000
Outstanding Balance
$50,220
Interest Rate
4%
Mortgage Type
New Conventional
Estimated Equity
$52,500
Purchase Details
Closed on
Sep 27, 2007
Sold by
Foster Russell and Foster Tina
Bought by
Foster Erin M and Foster Michael
Home Financials for this Owner
Home Financials are based on the most recent Mortgage that was taken out on this home.
Original Mortgage
$59,200
Interest Rate
6.66%
Mortgage Type
New Conventional
Create a Home Valuation Report for This Property
The Home Valuation Report is an in-depth analysis detailing your home's value as well as a comparison with similar homes in the area
Home Values in the Area
Average Home Value in this Area
Purchase History
| Date | Buyer | Sale Price | Title Company |
|---|---|---|---|
| Foster Michael | -- | -- | |
| Foster Erin M | $74,000 | None Available |
Source: Public Records
Mortgage History
| Date | Status | Borrower | Loan Amount |
|---|---|---|---|
| Open | Foster Michael | $61,000 | |
| Closed | Foster Erin M | $59,200 |
Source: Public Records
Tax History Compared to Growth
Tax History
| Year | Tax Paid | Tax Assessment Tax Assessment Total Assessment is a certain percentage of the fair market value that is determined by local assessors to be the total taxable value of land and additions on the property. | Land | Improvement |
|---|---|---|---|---|
| 2024 | $2,200 | $31,300 | $5,160 | $26,140 |
| 2023 | $2,052 | $29,350 | $4,840 | $24,510 |
| 2022 | $1,992 | $28,200 | $4,650 | $23,550 |
| 2021 | $2,073 | $29,450 | $4,850 | $24,600 |
| 2020 | $1,967 | $28,100 | $4,630 | $23,470 |
| 2019 | $2,093 | $29,670 | $4,890 | $24,780 |
| 2018 | $2,002 | $27,930 | $4,600 | $23,330 |
| 2017 | $1,909 | $26,250 | $4,320 | $21,930 |
| 2016 | $1,904 | $25,530 | $4,200 | $21,330 |
| 2015 | $1,856 | $24,730 | $4,070 | $20,660 |
| 2013 | $1,797 | $25,040 | $4,120 | $20,920 |
Source: Public Records
Map
Nearby Homes