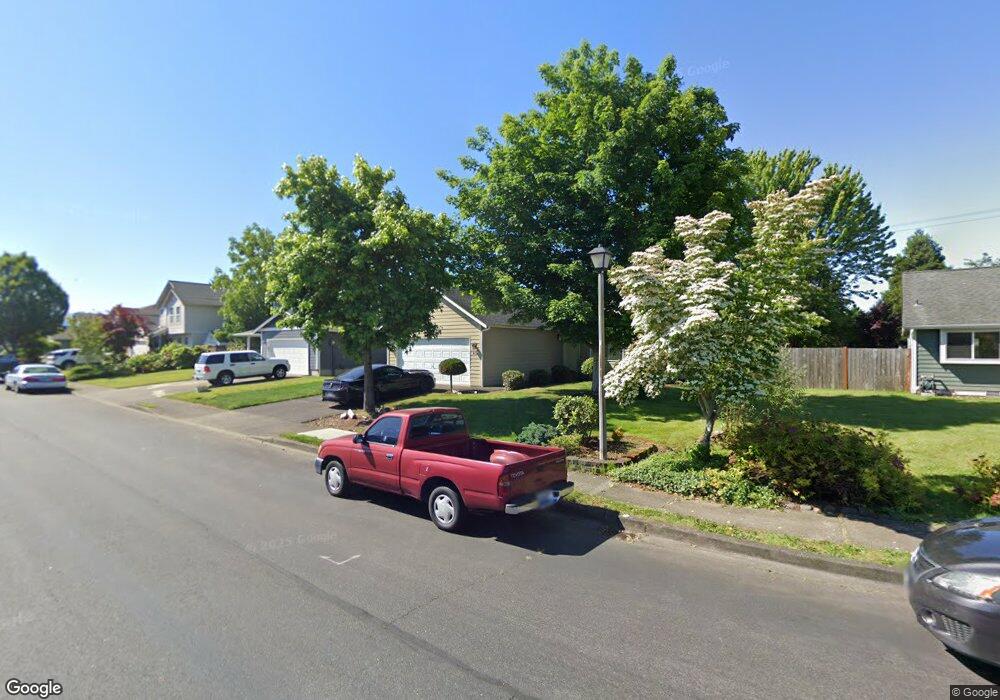
302 Orting Ct NW Orting, WA 98360
Estimated Value: $475,000 - $484,666
3
Beds
2
Baths
1,358
Sq Ft
$354/Sq Ft
Est. Value
About This Home
This home is located at 302 Orting Ct NW, Orting, WA 98360 and is currently estimated at $480,417, approximately $353 per square foot. 302 Orting Ct NW is a home located in Pierce County with nearby schools including Orting Elementary School, Ptarmigan Ridge Elementary School, and Orting Middle School.
Ownership History
Date
Name
Owned For
Owner Type
Purchase Details
Closed on
Dec 20, 2006
Sold by
Meier Shawn C
Bought by
Meier Shawn C and Meier Kelly
Current Estimated Value
Home Financials for this Owner
Home Financials are based on the most recent Mortgage that was taken out on this home.
Original Mortgage
$175,000
Outstanding Balance
$110,638
Interest Rate
7.37%
Mortgage Type
New Conventional
Estimated Equity
$369,779
Purchase Details
Closed on
Dec 14, 2000
Sold by
Meier Kelly I
Bought by
Meier Shawn C
Home Financials for this Owner
Home Financials are based on the most recent Mortgage that was taken out on this home.
Original Mortgage
$137,650
Interest Rate
7.67%
Purchase Details
Closed on
Jan 21, 1997
Sold by
River Shore Ltd Partnership
Bought by
Force Norman A and Force Tracy L
Home Financials for this Owner
Home Financials are based on the most recent Mortgage that was taken out on this home.
Original Mortgage
$122,909
Interest Rate
7.58%
Mortgage Type
FHA
Create a Home Valuation Report for This Property
The Home Valuation Report is an in-depth analysis detailing your home's value as well as a comparison with similar homes in the area
Home Values in the Area
Average Home Value in this Area
Purchase History
| Date | Buyer | Sale Price | Title Company |
|---|---|---|---|
| Meier Shawn C | -- | First American Title-Nla Se | |
| Meier Shawn C | -- | Stewart Title | |
| Meier Shawn C | $144,900 | Stewart Title | |
| Force Norman A | $126,062 | Transnation Title Insurance |
Source: Public Records
Mortgage History
| Date | Status | Borrower | Loan Amount |
|---|---|---|---|
| Open | Meier Shawn C | $175,000 | |
| Closed | Meier Shawn C | $137,650 | |
| Previous Owner | Force Norman A | $122,909 |
Source: Public Records
Tax History
| Year | Tax Paid | Tax Assessment Tax Assessment Total Assessment is a certain percentage of the fair market value that is determined by local assessors to be the total taxable value of land and additions on the property. | Land | Improvement |
|---|---|---|---|---|
| 2025 | $3,563 | $434,800 | $183,800 | $251,000 |
| 2024 | $3,563 | $414,200 | $174,100 | $240,100 |
| 2023 | $3,563 | $384,600 | $166,400 | $218,200 |
| 2022 | $3,387 | $398,200 | $166,400 | $231,800 |
| 2021 | $3,259 | $269,100 | $111,000 | $158,100 |
| 2019 | $2,906 | $241,400 | $94,200 | $147,200 |
| 2018 | $2,991 | $225,400 | $82,100 | $143,300 |
| 2017 | $2,780 | $198,300 | $65,900 | $132,400 |
| 2016 | $2,562 | $164,500 | $50,900 | $113,600 |
| 2014 | $2,105 | $152,900 | $45,500 | $107,400 |
| 2013 | $2,105 | $126,600 | $35,800 | $90,800 |
Source: Public Records
Map
Nearby Homes
- 310 Orting Ave NW
- 215 Corrin Ave NW Unit C
- 215 Corrin Ave NW Unit B
- 215 Corrin Ave NW Unit D
- 215 Corrin Ave NW Unit A
- 316 Bowlin Ave NE
- 724 Teetor Cir NW Unit LOT 12
- 726 Teetor Cir NW Unit Lot 13
- 722 Teetor Cir NW Unit Lot 11
- 121 van Scoyoc Ave SW
- 718 Teetor Cir NW Unit LOT 9
- 727 Teetor Cir NW Unit Lot 16
- 716 Teetor Cir NW Unit Lot 08
- 734 Teetor Cir NW Unit Lot 33
- 725 Teetor Cir NW Unit Lot 17
- 732 Teetor Cir NW Unit Lot 32
- 723 Teetor Cir NW Unit LOT 18
- 721 Teetor Cir NW Unit Lot 19
- 721 Teetor Cir NW
- 710 Teetor Cir NW
- 304 Orting Ct NW
- 301 Orting Ct NW
- 303 Orting Ct NW
- 306 Orting Ct NW
- 411 Kensington Ave NW
- 409 Kensington Ave NW
- 413 Kensington Ave NW
- 305 Orting Ct NW
- 406 Orting Ave NW
- 407 Kensington Ave NW
- 412 Orting Ave NW
- 415 Kensington Ave NW
- 501 Alexander Ct NW
- 503 Alexander Ct NW
- 417 Kensington Ave NW
- 405 Kensington Ave NW
- 404 Orting Ave NW
- 505 Alexander Ct NW
- 405 Orting Ave NW
- 414 Orting Ave NW
Your Personal Tour Guide
Ask me questions while you tour the home.