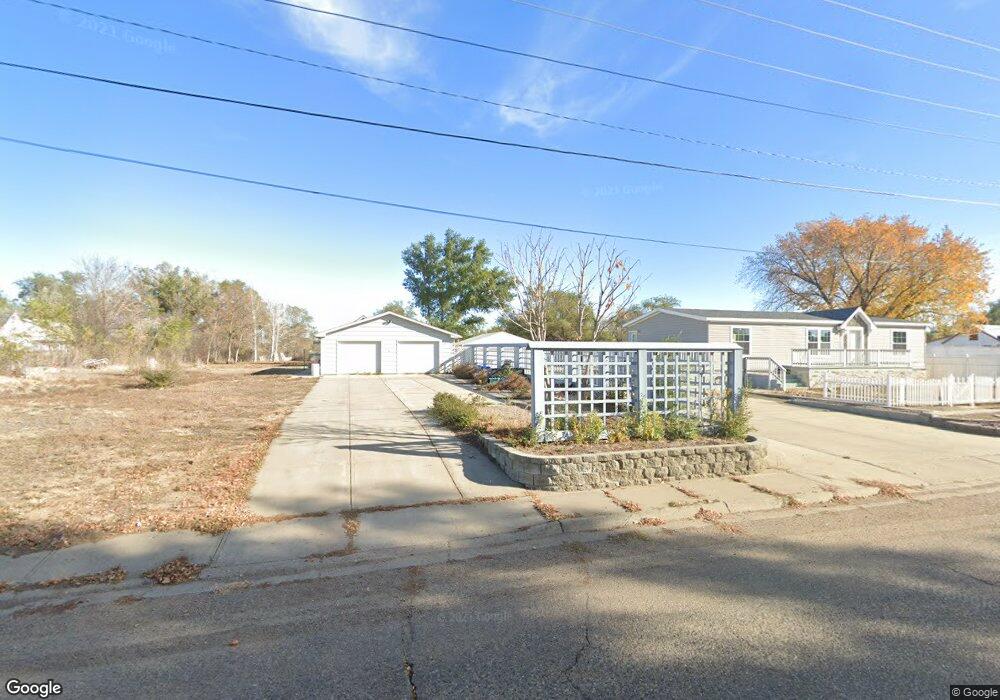
302 Pine St Glendive, MT 59330
Estimated Value: $153,000 - $277,093
3
Beds
2
Baths
1,352
Sq Ft
$164/Sq Ft
Est. Value
About This Home
This home is located at 302 Pine St, Glendive, MT 59330 and is currently estimated at $221,273, approximately $163 per square foot. 302 Pine St is a home located in Dawson County with nearby schools including Jefferson Elementary School, Lincoln School, and Washington Middle School.
Ownership History
Date
Name
Owned For
Owner Type
Purchase Details
Closed on
Mar 31, 2023
Sold by
Jones Thomas
Bought by
Rowles Andrew
Current Estimated Value
Home Financials for this Owner
Home Financials are based on the most recent Mortgage that was taken out on this home.
Original Mortgage
$183,120
Outstanding Balance
$177,784
Interest Rate
6.34%
Mortgage Type
New Conventional
Estimated Equity
$43,489
Purchase Details
Closed on
Mar 10, 2020
Sold by
Haltman Ralph A
Bought by
Jones Thomas K
Purchase Details
Closed on
May 12, 1993
Bought by
Knoll Patrick J and Hagen Joann Knoll
Create a Home Valuation Report for This Property
The Home Valuation Report is an in-depth analysis detailing your home's value as well as a comparison with similar homes in the area
Home Values in the Area
Average Home Value in this Area
Purchase History
| Date | Buyer | Sale Price | Title Company |
|---|---|---|---|
| Rowles Andrew | $228,900 | Flying S Title & Escrow | |
| Jones Thomas K | -- | Other | |
| Knoll Patrick J | -- | -- |
Source: Public Records
Mortgage History
| Date | Status | Borrower | Loan Amount |
|---|---|---|---|
| Open | Rowles Andrew | $183,120 |
Source: Public Records
Tax History
| Year | Tax Paid | Tax Assessment Tax Assessment Total Assessment is a certain percentage of the fair market value that is determined by local assessors to be the total taxable value of land and additions on the property. | Land | Improvement |
|---|---|---|---|---|
| 2025 | $2,070 | $150,961 | $0 | $0 |
| 2024 | $2,512 | $128,064 | $0 | $0 |
| 2023 | $2,402 | $128,064 | $0 | $0 |
| 2022 | $1,633 | $52,360 | $0 | $0 |
| 2021 | $1,594 | $52,360 | $0 | $0 |
| 2020 | $804 | $40,625 | $0 | $0 |
| 2019 | $731 | $31,665 | $0 | $0 |
| 2018 | $1,530 | $183,802 | $0 | $0 |
| 2017 | $1,620 | $183,800 | $0 | $0 |
| 2016 | $2,516 | $169,600 | $0 | $0 |
| 2015 | $1,651 | $169,600 | $0 | $0 |
| 2014 | $851 | $49,286 | $0 | $0 |
Source: Public Records
Map
Nearby Homes
Your Personal Tour Guide
Ask me questions while you tour the home.