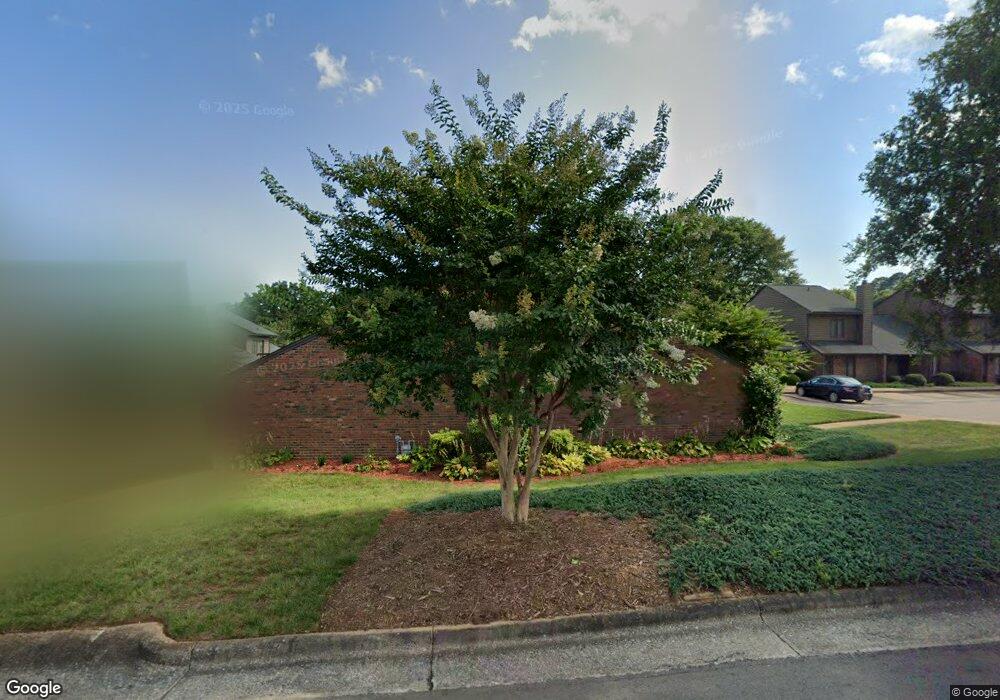
302 Pinkney St Unit 3 Shelby, NC 28150
Estimated Value: $165,000 - $178,000
Studio
--
Bath
973
Sq Ft
$176/Sq Ft
Est. Value
About This Home
This home is located at 302 Pinkney St Unit 3, Shelby, NC 28150 and is currently estimated at $171,318, approximately $176 per square foot. 302 Pinkney St Unit 3 is a home located in Cleveland County with nearby schools including Shelby Middle School, Shelby High School, and Pinnacle Classical Academy.
Ownership History
Date
Name
Owned For
Owner Type
Purchase Details
Closed on
Dec 6, 2017
Sold by
Anthony Laurin K and Anthony Kelly
Bought by
Anthony Laurin K
Current Estimated Value
Home Financials for this Owner
Home Financials are based on the most recent Mortgage that was taken out on this home.
Original Mortgage
$67,663
Outstanding Balance
$57,416
Interest Rate
4.25%
Mortgage Type
FHA
Estimated Equity
$113,902
Purchase Details
Closed on
Apr 28, 2015
Sold by
Smart Roy Odell
Bought by
Smart Kelly Anthony and Smart Roy Odell
Purchase Details
Closed on
Jan 22, 2015
Sold by
Hughes Nancy Hamrick and Hughes Michael
Bought by
Smart Roy Odell
Home Financials for this Owner
Home Financials are based on the most recent Mortgage that was taken out on this home.
Original Mortgage
$58,900
Interest Rate
4.01%
Mortgage Type
New Conventional
Purchase Details
Closed on
Feb 26, 2013
Sold by
Berry Jules V
Bought by
Hughes Nancy Hamrick
Purchase Details
Closed on
Dec 29, 2011
Sold by
Berry Anthony N and Berry Amy P
Bought by
Berry Jules
Create a Home Valuation Report for This Property
The Home Valuation Report is an in-depth analysis detailing your home's value as well as a comparison with similar homes in the area
Home Values in the Area
Average Home Value in this Area
Purchase History
| Date | Buyer | Sale Price | Title Company |
|---|---|---|---|
| Anthony Laurin K | -- | None Available | |
| Smart Kelly Anthony | -- | None Available | |
| Smart Roy Odell | $62,000 | None Available | |
| Hughes Nancy Hamrick | $83,000 | None Available | |
| Berry Jules | $82,000 | Attorney |
Source: Public Records
Mortgage History
| Date | Status | Borrower | Loan Amount |
|---|---|---|---|
| Open | Anthony Laurin K | $67,663 | |
| Closed | Smart Roy Odell | $58,900 |
Source: Public Records
Tax History
| Year | Tax Paid | Tax Assessment Tax Assessment Total Assessment is a certain percentage of the fair market value that is determined by local assessors to be the total taxable value of land and additions on the property. | Land | Improvement |
|---|---|---|---|---|
| 2025 | $1,437 | $144,434 | $11,460 | $132,974 |
| 2024 | $1,248 | $101,509 | $10,000 | $91,509 |
| 2023 | $1,242 | $101,509 | $10,000 | $91,509 |
| 2022 | $1,242 | $101,509 | $10,000 | $91,509 |
| 2021 | $1,248 | $101,509 | $10,000 | $91,509 |
| 2020 | $1,095 | $86,353 | $10,000 | $76,353 |
| 2019 | $1,095 | $86,353 | $10,000 | $76,353 |
| 2018 | $1,094 | $86,353 | $10,000 | $76,353 |
| 2017 | $1,067 | $86,353 | $10,000 | $76,353 |
| 2016 | $1,070 | $86,353 | $10,000 | $76,353 |
| 2015 | $957 | $81,228 | $10,000 | $71,228 |
| 2014 | $957 | $81,228 | $10,000 | $71,228 |
Source: Public Records
Map
Nearby Homes
- 401 Holman Dr Unit 4
- 607 Waylen St
- 419 Circle Dr W
- 503 Circle Dr E
- 419 Rocky Brook Dr
- 00 S Washington St
- 605 Oakley St
- 324 Beaumonde Ave
- 406 Jacob St
- 812 Kings Rd
- 304 Belvedere Ave
- 618 Live Oak St
- 322 Buffalo St
- 207 Knott St
- 417 W Graham St
- 319 Martin St
- 213 Knott St
- 424 Airline Extension
- 722 Live Oak St
- 702 Legrand St
- 302 Pinkney St Unit 4
- 302 Pinkney St Unit 1
- 302 Pinkney St Unit 5
- 302 Pinkney St Unit 2
- 302 Pinkney St
- 320-3 Patton Dr Unit 3
- 320 Patton Dr Unit 1
- 320 Patton Dr Unit 2
- 320 Patton Dr Unit 4
- 320 Patton Dr Unit 5
- 320 Patton Dr
- 300 Pinkney St Unit 300-4
- 300 Pinkney St Unit 5
- 300 Pinkney St Unit 4
- 300 Pinkney St Unit 3
- 300 Pinkney St Unit 2
- 300 Pinkney St Unit 1
- 300 Pinkney St
- 309 Pinkney St Unit 3
- 309 Pinkney St Unit 2
Your Personal Tour Guide
Ask me questions while you tour the home.