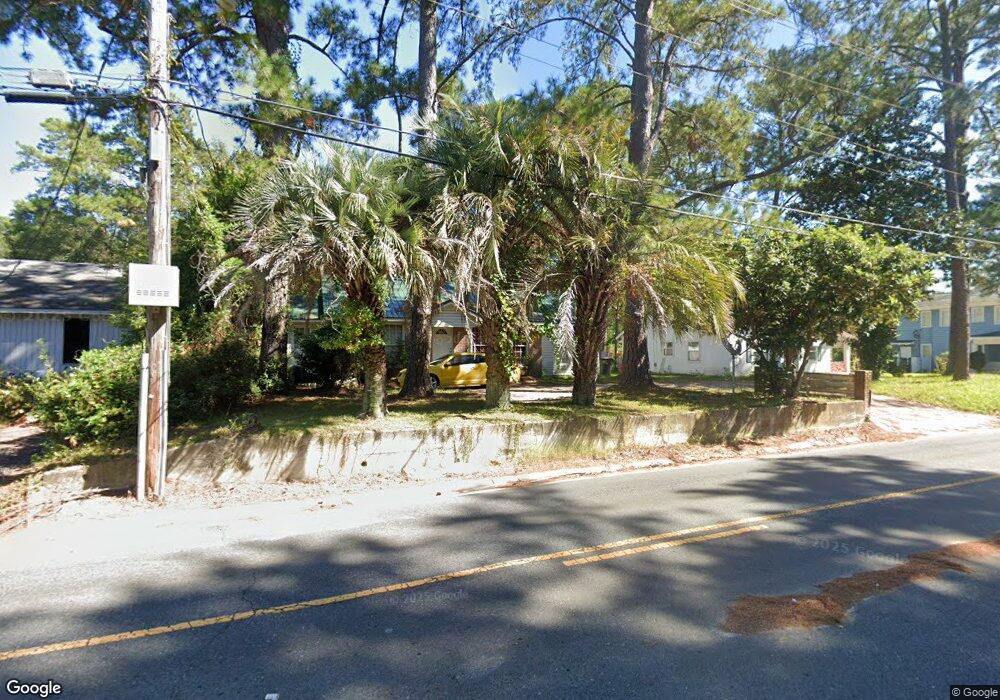
302 Riverside Dr Waycross, GA 31501
Estimated Value: $100,000 - $179,000
3
Beds
2
Baths
1,620
Sq Ft
$82/Sq Ft
Est. Value
About This Home
This home is located at 302 Riverside Dr, Waycross, GA 31501 and is currently estimated at $132,743, approximately $81 per square foot. 302 Riverside Dr is a home located in Ware County with nearby schools including Center Elementary School, Waycross Middle School, and Ware County High School.
Ownership History
Date
Name
Owned For
Owner Type
Purchase Details
Closed on
Aug 11, 2008
Sold by
Jones Arthur Bradley
Bought by
Patten Guo Ying Liang
Current Estimated Value
Purchase Details
Closed on
Jun 28, 2007
Sold by
Swain Scott
Bought by
Jones Arthur Bradley
Home Financials for this Owner
Home Financials are based on the most recent Mortgage that was taken out on this home.
Original Mortgage
$47,400
Interest Rate
6.37%
Mortgage Type
New Conventional
Purchase Details
Closed on
Jan 12, 2007
Sold by
Hsbc Mtg Svcs Inc
Bought by
Swain Scott and Swain Susan
Purchase Details
Closed on
May 2, 2006
Sold by
Boatright Patricia A
Bought by
Household Realty Corp
Purchase Details
Closed on
Dec 31, 2003
Sold by
Kirkland Barbara
Bought by
Boatright Patricia A
Purchase Details
Closed on
Jun 26, 2000
Sold by
Kirkland Wiley
Bought by
Kirkland Barbara
Purchase Details
Closed on
Feb 15, 2000
Sold by
Durham Billie Lee
Bought by
Kirkland Wiley & Bar
Create a Home Valuation Report for This Property
The Home Valuation Report is an in-depth analysis detailing your home's value as well as a comparison with similar homes in the area
Home Values in the Area
Average Home Value in this Area
Purchase History
| Date | Buyer | Sale Price | Title Company |
|---|---|---|---|
| Patten Guo Ying Liang | $47,733 | -- | |
| Jones Arthur Bradley | $49,900 | -- | |
| Swain Scott | $30,000 | -- | |
| Household Realty Corp | $52,397 | -- | |
| Boatright Patricia A | $51,600 | -- | |
| Kirkland Barbara | -- | -- | |
| Kirkland Wiley & Bar | $22,000 | -- |
Source: Public Records
Mortgage History
| Date | Status | Borrower | Loan Amount |
|---|---|---|---|
| Previous Owner | Jones Arthur Bradley | $47,400 |
Source: Public Records
Tax History Compared to Growth
Tax History
| Year | Tax Paid | Tax Assessment Tax Assessment Total Assessment is a certain percentage of the fair market value that is determined by local assessors to be the total taxable value of land and additions on the property. | Land | Improvement |
|---|---|---|---|---|
| 2024 | $1,094 | $46,220 | $1,260 | $44,960 |
| 2023 | $1,594 | $28,056 | $1,458 | $26,598 |
| 2022 | $1,102 | $27,650 | $1,458 | $26,192 |
| 2021 | $1,058 | $24,469 | $1,458 | $23,011 |
| 2020 | $1,066 | $24,469 | $1,458 | $23,011 |
| 2019 | $1,080 | $24,420 | $1,458 | $22,962 |
| 2018 | $1,027 | $23,018 | $1,458 | $21,560 |
| 2017 | $1,004 | $23,018 | $1,458 | $21,560 |
| 2016 | $1,004 | $23,018 | $1,458 | $21,560 |
| 2015 | $1,011 | $23,017 | $1,458 | $21,560 |
| 2014 | $1,010 | $23,018 | $1,458 | $21,560 |
| 2013 | -- | $23,017 | $1,458 | $21,559 |
Source: Public Records
Map
Nearby Homes
- 1405 Grove Ave
- 301 Riverside Dr
- 310 Butler St
- 1504 Habersham Dr
- 511 Riverside Dr
- .22 Alice St
- 807 College St
- 415 Dewey St
- 502 Dewey St
- 0 Beville St
- 511 Richmond Ave
- 1101 Cherokee Dr
- 506 Magnolia Dr
- 2022 Pioneer St
- 812 Effie St
- 1701 Satilla Blvd
- 00 Pineview Dr
- 0 Pineview Dr
- 808 Satilla Blvd
- 707 Euclid Ave
- 300 Riverside Dr
- Lot17,18 Riverside Dr
- 1 Riverside Dr
- 315 Riverside Dr
- 1407 Grove Ave
- 226 Riverside Dr
- 1406 Alice St
- 305 W Oneida St
- 307 W Oneida St
- 301 W Oneida St
- 1355 Grove Ave
- 229 Riverside Dr
- 1410 Alice St
- 229 W Oneida St
- 1412 Alice St
- 1415 Alice St
- 1304 Alice St
- 1405 Alice St
- 1353 Grove Ave
- B108 Coachman St