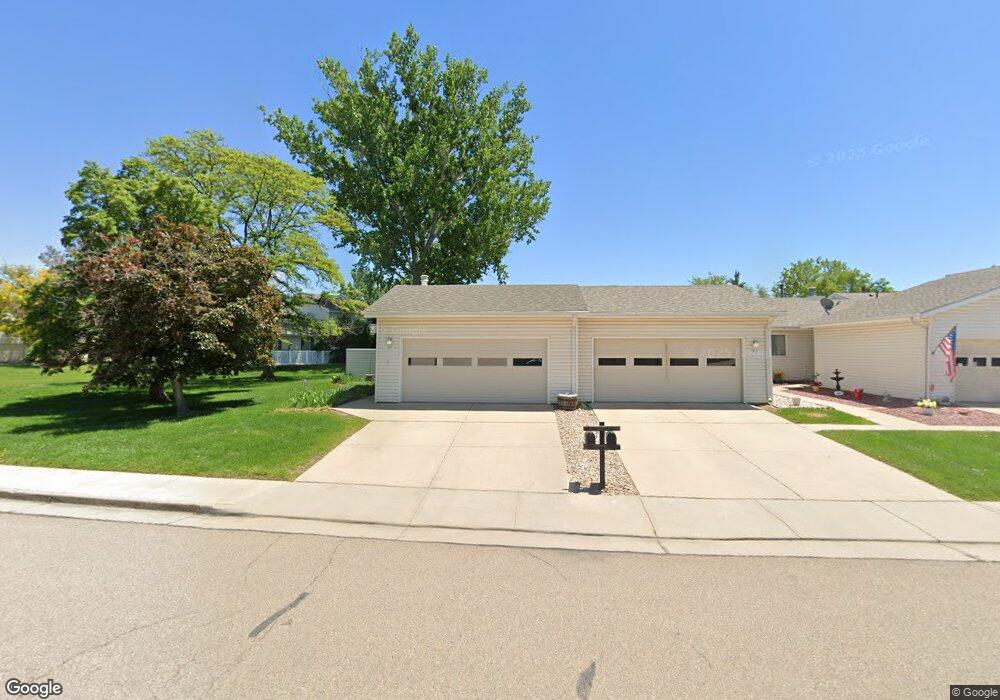
302 S 22nd Ave Brighton, CO 80601
Estimated Value: $330,000 - $398,000
3
Beds
2
Baths
1,240
Sq Ft
$294/Sq Ft
Est. Value
About This Home
This home is located at 302 S 22nd Ave, Brighton, CO 80601 and is currently estimated at $364,724, approximately $294 per square foot. 302 S 22nd Ave is a home located in Adams County with nearby schools including Southeast Elementary School, Vikan Middle School, and Brighton High School.
Ownership History
Date
Name
Owned For
Owner Type
Purchase Details
Closed on
May 22, 2013
Sold by
Quirk Michael S
Bought by
Guest Beverly
Current Estimated Value
Home Financials for this Owner
Home Financials are based on the most recent Mortgage that was taken out on this home.
Original Mortgage
$221,250
Outstanding Balance
$210,955
Interest Rate
3.41%
Mortgage Type
Reverse Mortgage Home Equity Conversion Mortgage
Estimated Equity
$153,769
Purchase Details
Closed on
May 30, 2008
Sold by
Hale Alaina M and Hale Arthur A
Bought by
Quirk Michael S
Home Financials for this Owner
Home Financials are based on the most recent Mortgage that was taken out on this home.
Original Mortgage
$140,000
Interest Rate
5.89%
Mortgage Type
Seller Take Back
Purchase Details
Closed on
Aug 31, 1998
Sold by
Zimbelman Robert G and Zimbelman James D
Bought by
Hale Alaina M and Hale Arthur A
Create a Home Valuation Report for This Property
The Home Valuation Report is an in-depth analysis detailing your home's value as well as a comparison with similar homes in the area
Home Values in the Area
Average Home Value in this Area
Purchase History
| Date | Buyer | Sale Price | Title Company |
|---|---|---|---|
| Guest Beverly | $147,500 | Fidelity National Title Insu | |
| Quirk Michael S | $157,500 | Security Title | |
| Hale Alaina M | $122,000 | Land Title |
Source: Public Records
Mortgage History
| Date | Status | Borrower | Loan Amount |
|---|---|---|---|
| Open | Guest Beverly | $221,250 | |
| Previous Owner | Quirk Michael S | $140,000 |
Source: Public Records
Tax History Compared to Growth
Tax History
| Year | Tax Paid | Tax Assessment Tax Assessment Total Assessment is a certain percentage of the fair market value that is determined by local assessors to be the total taxable value of land and additions on the property. | Land | Improvement |
|---|---|---|---|---|
| 2024 | $1,646 | $22,690 | $5,000 | $17,690 |
| 2023 | $2,387 | $25,230 | $4,600 | $20,630 |
| 2022 | $2,342 | $21,120 | $3,890 | $17,230 |
| 2021 | $2,205 | $21,120 | $3,890 | $17,230 |
| 2020 | $1,974 | $19,760 | $4,000 | $15,760 |
| 2019 | $1,979 | $19,760 | $4,000 | $15,760 |
| 2018 | $1,725 | $17,180 | $1,370 | $15,810 |
| 2017 | $1,728 | $17,180 | $1,370 | $15,810 |
| 2016 | $1,202 | $11,890 | $1,510 | $10,380 |
| 2015 | $1,194 | $11,890 | $1,510 | $10,380 |
| 2014 | $1,008 | $10,160 | $1,510 | $8,650 |
Source: Public Records
Map
Nearby Homes
- 316 S 22nd Ave
- 290 S 22nd Ave
- 253 S 25th Ave
- 319 S 25th Ave
- 321 S 26th Ave
- 465 S 24th Ave
- 2084 Donna Ct
- 2618 E Egbert St
- 2587 E Egbert St
- 2608 E Egbert St
- 2617 E Egbert St
- 551 Longhurst Place
- 63 S 22nd Ave Unit A1-B8
- 595 Badger Creek Dr
- 406 S 16th Ave
- 434 Voiles Dr
- 2277 Wingler Place
- 3060 E Bridge St Unit 159
- 3060 E Bridge St Unit 277
- 3060 E Bridge St Unit 213
- 306 S 22nd Ave
- 308 S 22nd Ave
- 300 S 22nd Ave
- 298 S 22nd Ave
- 296 S 22nd Ave
- 310 S 22nd Ave
- 294 S 22nd Ave
- 312 S 22nd Ave
- 295 S 22nd Ave
- 301 S 22nd Ave
- 292 S 22nd Ave
- 314 S 22nd Ave
- 311 S 22nd Ave
- 285 S 21st Place
- 275 S 22nd Ave
- 250 S 22nd Ave
- 252 S 22nd Ave
- 248 S 22nd Ave
- 321 S 22nd Ave
- 254 S 22nd Ave