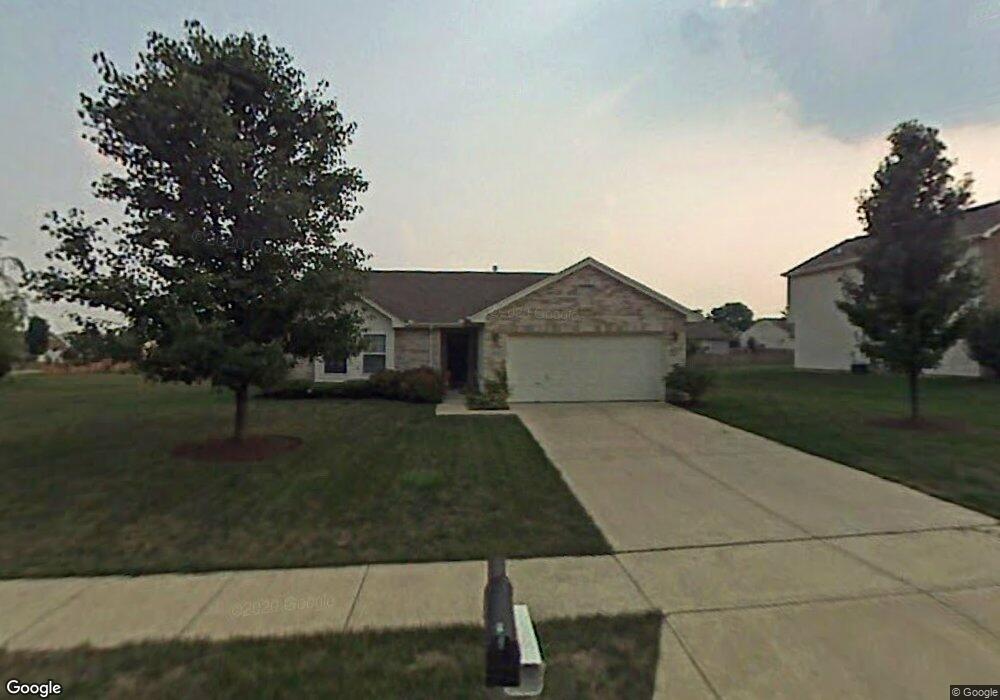
302 Sagebrush Dr Clayton, OH 45315
Estimated Value: $232,000 - $287,000
3
Beds
2
Baths
1,216
Sq Ft
$210/Sq Ft
Est. Value
About This Home
This home is located at 302 Sagebrush Dr, Clayton, OH 45315 and is currently estimated at $255,851, approximately $210 per square foot. 302 Sagebrush Dr is a home located in Montgomery County with nearby schools including Northmont High School and Salem Christian Academy.
Ownership History
Date
Name
Owned For
Owner Type
Purchase Details
Closed on
Aug 11, 2016
Sold by
Shirley Deborah L Miller
Bought by
Griffith Matthew R
Current Estimated Value
Home Financials for this Owner
Home Financials are based on the most recent Mortgage that was taken out on this home.
Original Mortgage
$123,000
Outstanding Balance
$97,917
Interest Rate
3.41%
Mortgage Type
VA
Estimated Equity
$157,934
Purchase Details
Closed on
Mar 1, 2011
Sold by
Miller Betty C and Miller Betty Litte Clancy
Bought by
Shirley Deborah L Miller and The Betty C Miller Family Preervation Tr
Purchase Details
Closed on
Dec 4, 2002
Sold by
Miller Betty C and Clancy Betty Little
Bought by
Miller Betty Little Clancy
Purchase Details
Closed on
Aug 28, 2000
Sold by
Crossmann Communities Of Ohio Inc
Bought by
Miller Betty C
Home Financials for this Owner
Home Financials are based on the most recent Mortgage that was taken out on this home.
Original Mortgage
$52,495
Interest Rate
8.05%
Create a Home Valuation Report for This Property
The Home Valuation Report is an in-depth analysis detailing your home's value as well as a comparison with similar homes in the area
Home Values in the Area
Average Home Value in this Area
Purchase History
| Date | Buyer | Sale Price | Title Company |
|---|---|---|---|
| Griffith Matthew R | $123,000 | National Title Company | |
| Shirley Deborah L Miller | -- | Attorney | |
| Miller Betty Little Clancy | -- | Attorney | |
| Miller Betty Little Clancy | -- | -- | |
| Miller Betty C | $123,100 | -- |
Source: Public Records
Mortgage History
| Date | Status | Borrower | Loan Amount |
|---|---|---|---|
| Open | Griffith Matthew R | $123,000 | |
| Previous Owner | Miller Betty C | $52,495 |
Source: Public Records
Tax History Compared to Growth
Tax History
| Year | Tax Paid | Tax Assessment Tax Assessment Total Assessment is a certain percentage of the fair market value that is determined by local assessors to be the total taxable value of land and additions on the property. | Land | Improvement |
|---|---|---|---|---|
| 2024 | $3,591 | $62,980 | $15,440 | $47,540 |
| 2023 | $3,591 | $62,980 | $15,440 | $47,540 |
| 2022 | $3,700 | $49,980 | $12,250 | $37,730 |
| 2021 | $3,711 | $49,980 | $12,250 | $37,730 |
| 2020 | $3,642 | $49,980 | $12,250 | $37,730 |
| 2019 | $3,572 | $43,950 | $13,600 | $30,350 |
| 2018 | $3,507 | $43,950 | $13,600 | $30,350 |
| 2017 | $3,483 | $43,950 | $13,600 | $30,350 |
| 2016 | $3,300 | $39,880 | $12,250 | $27,630 |
| 2015 | $2,302 | $39,880 | $12,250 | $27,630 |
| 2014 | $2,302 | $39,880 | $12,250 | $27,630 |
| 2012 | -- | $44,480 | $12,250 | $32,230 |
Source: Public Records
Map
Nearby Homes
- 8849 Meiring St
- 4784 Molunat
- 86 Scott Dr
- 325 Beechgrove Dr
- Chatham Plan at Wenger Village
- Milford Plan at Wenger Village
- Holcombe Plan at Wenger Village
- Newcastle Plan at Wenger Village
- Pendleton Plan at Wenger Village
- Bellamy Plan at Wenger Village
- Henley Plan at Wenger Village
- 114 Brumbaugh Ct
- 318 Shady Tree Ct
- 5769 Dill Blvd
- 7980 Parsley Place
- 7746 Cilantro Way
- 7739 Cilantro Way
- 508 Korner Ave
- 7706 Cilantro Way
- 306 Pauly Dr
- 304 Sagebrush Dr
- 1019 Lofton Dr
- 103 Sonoma Ct
- 101 Sonoma Ct
- 306 Sagebrush Dr
- 105 Sonoma Ct
- 1001 Thistledown Trace
- 301 Sagebrush Dr
- 107 Sonoma Ct
- 2002 Haywood Cir
- 1020 Lofton Dr
- 1018 Lofton Dr
- 109 Sonoma Ct
- 1016 Lofton Dr
- 1015 Lofton Dr
- 102 Sonoma Ct
- 1003 Thistledown Trace
- 205 Sagebrush Dr
- 310 Sagebrush Dr
- 1004 Thistledown Trace