Estimated Value: $211,462 - $226,000
3
Beds
2
Baths
1,544
Sq Ft
$141/Sq Ft
Est. Value
About This Home
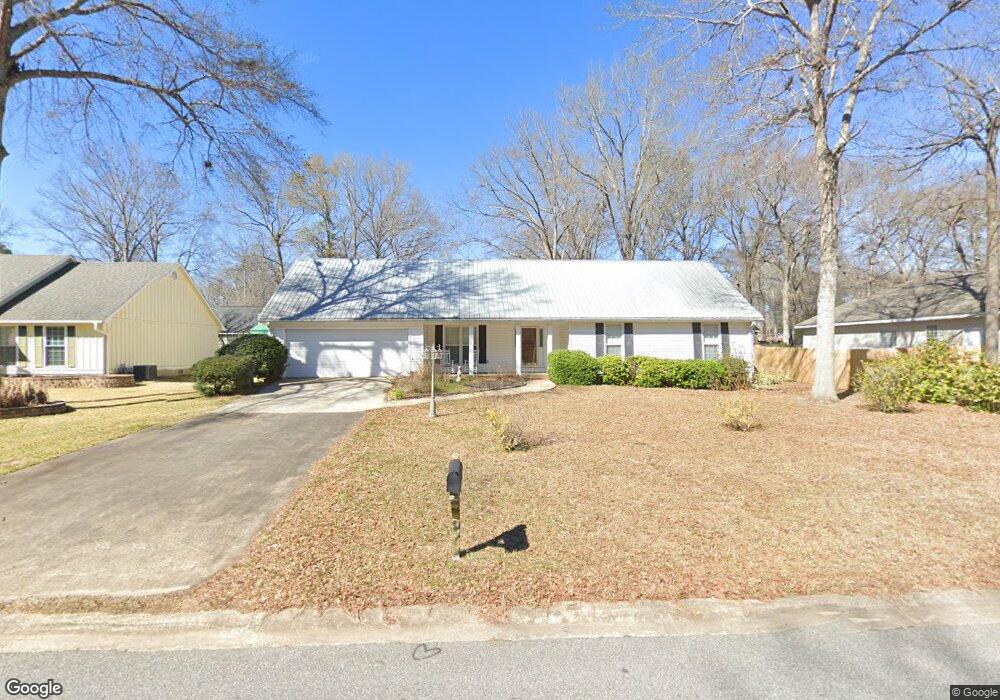
This home is located at 302 Shane Cir, Perry, GA 31069 and is currently estimated at $218,366, approximately $141 per square foot. 302 Shane Cir is a home located in Houston County with nearby schools including Tucker Elementary School, Perry Middle School, and Perry High School.
Ownership History
Date
Name
Owned For
Owner Type
Purchase Details
Closed on
Mar 10, 2023
Sold by
Matthews Randy L Le
Bought by
Lastoskie Bernhard Thomas
Current Estimated Value
Home Financials for this Owner
Home Financials are based on the most recent Mortgage that was taken out on this home.
Original Mortgage
$184,140
Outstanding Balance
$177,093
Interest Rate
6.13%
Mortgage Type
Construction
Estimated Equity
$41,273
Purchase Details
Closed on
Jul 25, 2005
Sold by
O'Neal Randall L
Bought by
Matthews Betty and Matthews Randy L
Purchase Details
Closed on
Aug 27, 1999
Sold by
O'Neal Denise D
Bought by
O'Neal Randall L
Purchase Details
Closed on
Jul 2, 1992
Sold by
Chapman Lena Mayola
Bought by
O'Neal Randall L and O'Neal Denise D
Purchase Details
Closed on
Feb 6, 1992
Sold by
Santos Anthony S and Santos Linda A
Bought by
Chapman Lena Mayola
Purchase Details
Closed on
Dec 1, 1988
Sold by
Stokes Real Estate Corp
Bought by
Santos Anthony S and Santos Linda A
Purchase Details
Closed on
Oct 30, 1987
Sold by
Stokes W F
Bought by
Stokes Real Estate Corp
Create a Home Valuation Report for This Property
The Home Valuation Report is an in-depth analysis detailing your home's value as well as a comparison with similar homes in the area
Home Values in the Area
Average Home Value in this Area
Purchase History
| Date | Buyer | Sale Price | Title Company |
|---|---|---|---|
| Lastoskie Bernhard Thomas | $180,000 | -- | |
| Matthews Betty | $110,000 | -- | |
| O'Neal Randall L | -- | -- | |
| O'Neal Randall L | $78,900 | -- | |
| Chapman Lena Mayola | $74,500 | -- | |
| Santos Anthony S | -- | -- | |
| Stokes Real Estate Corp | -- | -- |
Source: Public Records
Mortgage History
| Date | Status | Borrower | Loan Amount |
|---|---|---|---|
| Open | Lastoskie Bernhard Thomas | $184,140 |
Source: Public Records
Tax History
| Year | Tax Paid | Tax Assessment Tax Assessment Total Assessment is a certain percentage of the fair market value that is determined by local assessors to be the total taxable value of land and additions on the property. | Land | Improvement |
|---|---|---|---|---|
| 2025 | $2,070 | $70,400 | $10,000 | $60,400 |
| 2024 | $2,189 | $60,800 | $10,000 | $50,800 |
| 2023 | $1,876 | $50,720 | $10,000 | $40,720 |
| 2022 | $823 | $44,920 | $8,000 | $36,920 |
| 2021 | $744 | $41,320 | $8,000 | $33,320 |
| 2020 | $721 | $40,160 | $8,000 | $32,160 |
| 2019 | $721 | $40,160 | $8,000 | $32,160 |
| 2018 | $721 | $40,160 | $8,000 | $32,160 |
| 2017 | $721 | $40,160 | $8,000 | $32,160 |
| 2016 | $722 | $40,160 | $8,000 | $32,160 |
| 2015 | $722 | $40,160 | $8,000 | $32,160 |
| 2014 | -- | $40,160 | $8,000 | $32,160 |
| 2013 | -- | $39,720 | $8,000 | $31,720 |
Source: Public Records
Map
Nearby Homes
- 1423 Tucker Rd
- 528 Ansley Ave
- 614 Hillcrest Ave
- 625 Cooper St
- 624 Pine Ridge St
- 634 Pine Ridge St
- 1432 Duncan Ave
- 1207 Tucker Rd
- 117 Constance Ct
- 118 Constance Ct
- 903 Massee Ln
- 1 Pleasant Oaks Dr
- 3 Pleasant Oaks Dr
- 107 Water Run Way
- 214 Farmland Cir
- 203 Farrell Way
- 214 Farmland Cir Unit LOT 8 AG
- 4 Pleasant Oak Dr
- 2 Pleasant Oaks Dr
- 0 Carroll Aly
Your Personal Tour Guide
Ask me questions while you tour the home.