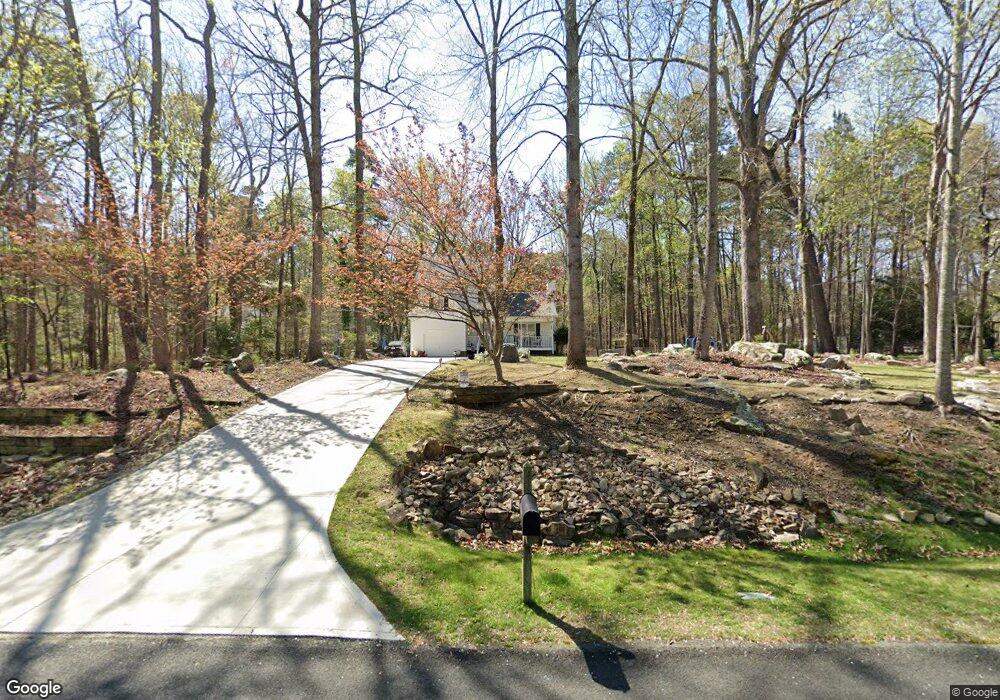
302 Stonehill Rd Chapel Hill, NC 27516
Estimated Value: $453,000 - $514,000
3
Beds
3
Baths
1,690
Sq Ft
$280/Sq Ft
Est. Value
About This Home
This home is located at 302 Stonehill Rd, Chapel Hill, NC 27516 and is currently estimated at $473,580, approximately $280 per square foot. 302 Stonehill Rd is a home located in Chatham County with nearby schools including Margaret B. Pollard Middle School, Northwood High, and Woods Charter.
Ownership History
Date
Name
Owned For
Owner Type
Purchase Details
Closed on
Sep 11, 2018
Sold by
Royster Steven Mitchem and Royster Brittany H
Bought by
Royster David W and Royster Jennifer W
Current Estimated Value
Home Financials for this Owner
Home Financials are based on the most recent Mortgage that was taken out on this home.
Original Mortgage
$184,000
Outstanding Balance
$157,517
Interest Rate
3.87%
Mortgage Type
Adjustable Rate Mortgage/ARM
Estimated Equity
$316,063
Purchase Details
Closed on
Jun 26, 2008
Sold by
Lloyd Tammy Lynn Morris and Lloyd Charles C
Bought by
Royster Steven Mitchem and Hunter Bittany Christine
Home Financials for this Owner
Home Financials are based on the most recent Mortgage that was taken out on this home.
Original Mortgage
$210,000
Interest Rate
4.25%
Mortgage Type
Purchase Money Mortgage
Create a Home Valuation Report for This Property
The Home Valuation Report is an in-depth analysis detailing your home's value as well as a comparison with similar homes in the area
Home Values in the Area
Average Home Value in this Area
Purchase History
| Date | Buyer | Sale Price | Title Company |
|---|---|---|---|
| Royster David W | $230,000 | None Available | |
| Royster Steven Mitchem | $246,000 | None Available |
Source: Public Records
Mortgage History
| Date | Status | Borrower | Loan Amount |
|---|---|---|---|
| Open | Royster David W | $184,000 | |
| Previous Owner | Royster Steven Mitchem | $210,000 |
Source: Public Records
Tax History Compared to Growth
Tax History
| Year | Tax Paid | Tax Assessment Tax Assessment Total Assessment is a certain percentage of the fair market value that is determined by local assessors to be the total taxable value of land and additions on the property. | Land | Improvement |
|---|---|---|---|---|
| 2025 | $3,367 | $457,195 | $91,152 | $366,043 |
| 2024 | $3,367 | $284,331 | $62,367 | $221,964 |
| 2023 | $2,562 | $284,331 | $62,367 | $221,964 |
| 2022 | $2,298 | $277,575 | $62,367 | $215,208 |
| 2021 | $2,271 | $277,575 | $62,367 | $215,208 |
| 2020 | $2,154 | $260,838 | $50,373 | $210,465 |
| 2019 | $2,154 | $260,838 | $50,373 | $210,465 |
| 2018 | $2,032 | $260,838 | $50,373 | $210,465 |
| 2017 | $2,032 | $260,838 | $50,373 | $210,465 |
| 2016 | $1,965 | $249,671 | $47,975 | $201,696 |
| 2015 | $1,935 | $249,671 | $47,975 | $201,696 |
| 2014 | $1,897 | $249,671 | $47,975 | $201,696 |
| 2013 | -- | $249,671 | $47,975 | $201,696 |
Source: Public Records
Map
Nearby Homes
- 82 Margaret Daniel Ln
- 103 Stonehill Rd
- 51 Araya Ln
- 105 Trailwood Ct
- 34 Chestnut Way
- 23 Bonterra Way
- 708 October Woods Rd
- 594 Cedar Lake Rd Unit A & B
- 3537 Lodge Trail
- 348 Cedar Lake Rd Unit A & B
- 110 Wolfs Trail
- 403 Brandywine Rd
- 2306 Damascus Church Rd
- 17 Monteith Dr
- 39 Monteith Dr
- 556 Great Ridge Pkwy
- 560 Great Ridge Pkwy
- 586 Great Ridge Pkwy
- 540 Patterson Dr
- 1705 Smith Level Rd Unit A
- 100 Woodbend Ct
- 102 Woodbend Ct
- 305 Stonehill Rd
- 305 Stonehill Rd
- 202 Stonehill Rd
- 307 Stonehill Rd
- 303 Stonehill Rd
- 104 Woodbend Ct
- 101 Woodbend Ct
- 301 Stonehill Rd
- 200 Stonehill Rd
- 106 Woodbend Ct
- 103 Woodbend Ct
- 401 Stonehill Rd
- 205 Stonehill Rd
- 402 Stonehill Rd
- 102 Greenbriar Ct
- 87 Danning Dr
- 205 Stone Hill Rd
- 106 Stonehill Rd