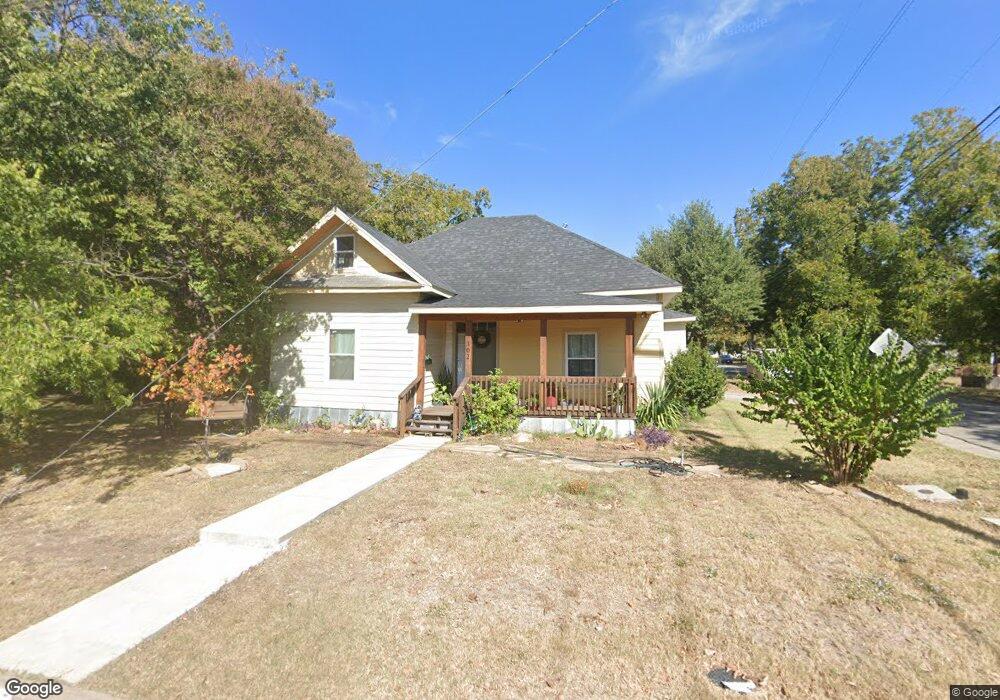
302 W Leland Ave McKinney, TX 75069
Faubion NeighborhoodEstimated Value: $244,853 - $353,000
--
Bed
--
Bath
1,389
Sq Ft
$231/Sq Ft
Est. Value
About This Home
This home is located at 302 W Leland Ave, McKinney, TX 75069 and is currently estimated at $320,963, approximately $231 per square foot. 302 W Leland Ave is a home located in Collin County with nearby schools including Burks Elementary School, Faubion Middle School, and McKinney Boyd High School.
Ownership History
Date
Name
Owned For
Owner Type
Purchase Details
Closed on
Feb 28, 2006
Sold by
Bankhead Wallace Barefoot and Bankhead Donis Donaldson
Bought by
Aguilar Ricardo and Aguilar Ricardo
Current Estimated Value
Home Financials for this Owner
Home Financials are based on the most recent Mortgage that was taken out on this home.
Original Mortgage
$55,500
Interest Rate
6.05%
Mortgage Type
Seller Take Back
Purchase Details
Closed on
Jan 28, 1999
Sold by
Bankhead Wallace Barefoot and Bankhead Donis Donaldson
Bought by
Woods Brent A
Home Financials for this Owner
Home Financials are based on the most recent Mortgage that was taken out on this home.
Original Mortgage
$71,000
Interest Rate
6.68%
Purchase Details
Closed on
Aug 29, 1997
Sold by
Bryson Florence
Bought by
Caster Donald R and Caster Shirley
Home Financials for this Owner
Home Financials are based on the most recent Mortgage that was taken out on this home.
Original Mortgage
$85,890
Interest Rate
7.46%
Mortgage Type
FHA
Create a Home Valuation Report for This Property
The Home Valuation Report is an in-depth analysis detailing your home's value as well as a comparison with similar homes in the area
Home Values in the Area
Average Home Value in this Area
Purchase History
| Date | Buyer | Sale Price | Title Company |
|---|---|---|---|
| Aguilar Ricardo | -- | None Available | |
| Woods Brent A | -- | -- | |
| Caster Donald R | -- | -- |
Source: Public Records
Mortgage History
| Date | Status | Borrower | Loan Amount |
|---|---|---|---|
| Closed | Aguilar Ricardo | $55,500 | |
| Previous Owner | Woods Brent A | $71,000 | |
| Previous Owner | Caster Donald R | $85,890 |
Source: Public Records
Tax History Compared to Growth
Tax History
| Year | Tax Paid | Tax Assessment Tax Assessment Total Assessment is a certain percentage of the fair market value that is determined by local assessors to be the total taxable value of land and additions on the property. | Land | Improvement |
|---|---|---|---|---|
| 2025 | $3,683 | $249,509 | $150,000 | $142,058 |
| 2024 | $3,683 | $207,924 | $128,000 | $79,924 |
| 2023 | $3,683 | $195,001 | $128,000 | $67,001 |
| 2022 | $3,520 | $175,633 | $112,000 | $63,633 |
| 2021 | $2,892 | $136,171 | $72,000 | $64,171 |
| 2020 | $2,892 | $127,945 | $68,000 | $59,945 |
| 2019 | $3,045 | $128,084 | $56,000 | $72,084 |
| 2018 | $3,097 | $127,337 | $52,000 | $75,337 |
| 2017 | $2,666 | $109,621 | $48,000 | $61,621 |
| 2016 | $2,310 | $93,044 | $40,000 | $53,044 |
| 2015 | $1,710 | $77,625 | $28,000 | $49,625 |
Source: Public Records
Map
Nearby Homes
- 1208 N Church St
- 1108 N Church St
- 1311 Coleman St
- 1017 N Church St
- 1215 Coleman St
- 1207 Coleman St
- 1611 N College St
- 407 W Erwin Ave
- 711 Pearson Ave
- 1616 N Bradley St
- 708 W White Ave
- 710 W White Ave
- 1419 N Bradley St
- 1013 Sherman St
- 607 W Erwin Ave
- 609 N Tennessee St
- 1611 Oak St
- 1205 N Bradley St
- 915 Coleman St
- 803 Inwood Dr
- 304 W Leland Ave
- 1207 N Church St
- 1119 N Church St
- 306 W Leland Ave
- 203 W Leland Ave
- 202 W Leland Ave
- 303 W Leland Ave
- 402 W Leland Ave
- 305 W Leland Ave
- 1210 N Church St
- 301 Pearson Ave
- 1117 N Church St
- 303 Pearson Ave
- 1114 N Church St
- 201 W Leland Ave
- 104 W Leland Ave
- 305 Pearson Ave
- 1212 N Church St
- 404 W Leland Ave
- 401 W Leland Ave