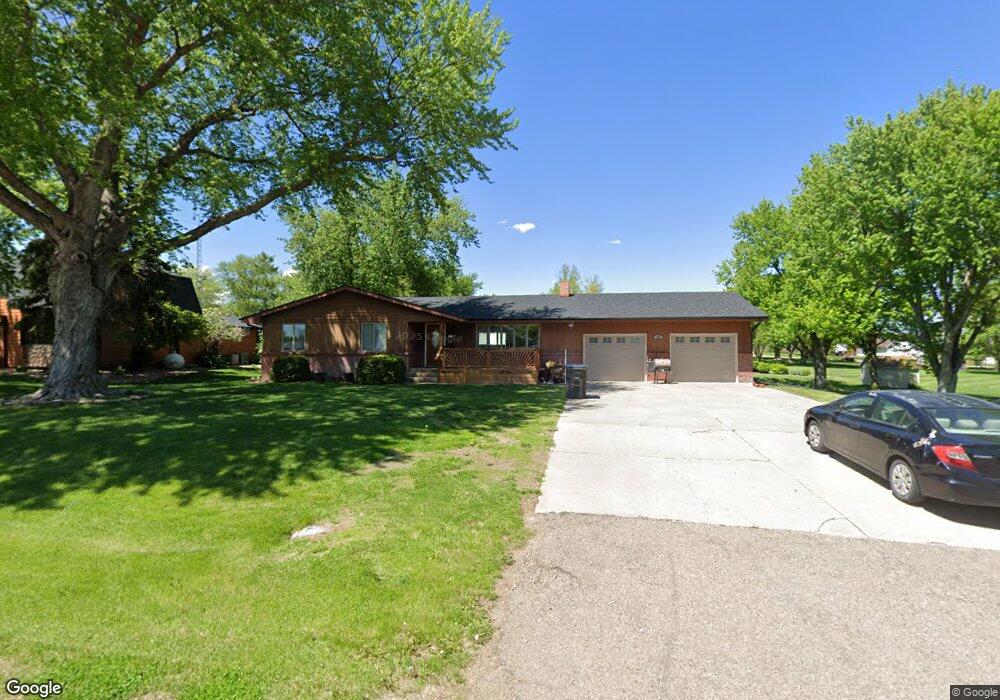
302 W M St Mc Cool Junction, NE 68401
Estimated Value: $119,000 - $268,000
2
Beds
2
Baths
1,344
Sq Ft
$168/Sq Ft
Est. Value
About This Home
This home is located at 302 W M St, Mc Cool Junction, NE 68401 and is currently estimated at $225,129, approximately $167 per square foot. 302 W M St is a home with nearby schools including McCool Junction Elementary School and McCool Junction Junior/Senior High School.
Ownership History
Date
Name
Owned For
Owner Type
Purchase Details
Closed on
Jun 5, 2023
Sold by
Coffey Jeremy and Coffey Kaylee A
Bought by
Stutzman Caleb C
Current Estimated Value
Purchase Details
Closed on
Oct 18, 2022
Sold by
Prince Linda and Prince Dale
Bought by
Coffey Jeremy F and Coffey Kaylee A
Home Financials for this Owner
Home Financials are based on the most recent Mortgage that was taken out on this home.
Original Mortgage
$176,000
Interest Rate
6.7%
Mortgage Type
New Conventional
Purchase Details
Closed on
May 4, 2022
Sold by
Prince Dale and Prince Linda
Bought by
Prince Linda
Purchase Details
Closed on
May 29, 2018
Sold by
Neville Dennis J and Neville Anita M
Bought by
Prince Dale and Prince Linda
Home Financials for this Owner
Home Financials are based on the most recent Mortgage that was taken out on this home.
Original Mortgage
$147,283
Interest Rate
4.5%
Mortgage Type
FHA
Purchase Details
Closed on
Nov 6, 2015
Sold by
Norquest Scott and Norquest Mary Catherine
Bought by
Neville Dennis J and Neville Anita M
Create a Home Valuation Report for This Property
The Home Valuation Report is an in-depth analysis detailing your home's value as well as a comparison with similar homes in the area
Purchase History
| Date | Buyer | Sale Price | Title Company |
|---|---|---|---|
| Stutzman Caleb C | $100,000 | York County Title | |
| Coffey Jeremy F | -- | Home Services Title | |
| Prince Linda | -- | -- | |
| Prince Linda | -- | None Listed On Document | |
| Prince Dale | $150,000 | York County Title Co | |
| Neville Dennis J | -- | York Country Title Company |
Source: Public Records
Mortgage History
| Date | Status | Borrower | Loan Amount |
|---|---|---|---|
| Previous Owner | Coffey Jeremy F | $176,000 | |
| Previous Owner | Prince Dale | $147,283 |
Source: Public Records
Tax History
| Year | Tax Paid | Tax Assessment Tax Assessment Total Assessment is a certain percentage of the fair market value that is determined by local assessors to be the total taxable value of land and additions on the property. | Land | Improvement |
|---|---|---|---|---|
| 2025 | $303 | $29,570 | $14,500 | $15,070 |
| 2024 | $2,143 | $155,074 | $11,700 | $143,374 |
| 2023 | $2,260 | $155,074 | $11,700 | $143,374 |
| 2022 | $2,239 | $155,106 | $11,700 | $143,406 |
| 2021 | $2,205 | $148,124 | $11,700 | $136,424 |
| 2020 | $2,257 | $141,175 | $11,700 | $129,475 |
| 2019 | $2,898 | $154,577 | $11,700 | $142,877 |
| 2018 | $3,172 | $166,284 | $11,700 | $154,584 |
| 2017 | $2,881 | $159,337 | $11,700 | $147,637 |
| 2016 | $2,415 | $129,105 | $11,200 | $117,905 |
| 2015 | $2,186 | $125,118 | $11,200 | $113,918 |
| 2014 | $2,090 | $125,118 | $11,200 | $113,918 |
Source: Public Records
Map
Nearby Homes
- LOT 5 Blk 2 St
- LOT 6 Blk 3 St
- LOT 5 Blk 3 St
- LOT 4 Blk 3 St
- Lot 2 Blk 3 St
- Lot 1 Blk 2 St
- Lot 4 Blk 2 St
- Lot 10 Blk 1 St
- LOT 2 Blk 2 St
- LOT 1 Blk 1 3rd Add St
- Lot 3 Blk 2 St
- LOT 9 Blk 1 St
- 300 Jo Ln
- Lot 4 Blk 1 St
- Lot 8 Blk 1 St
- LOT 5 Blk 1 St
- LOT 7 Blk 1 St
- Lot 6 Blk 1 St
- 3120 S Lincoln Ave
- 475 9th Ave
Your Personal Tour Guide
Ask me questions while you tour the home.