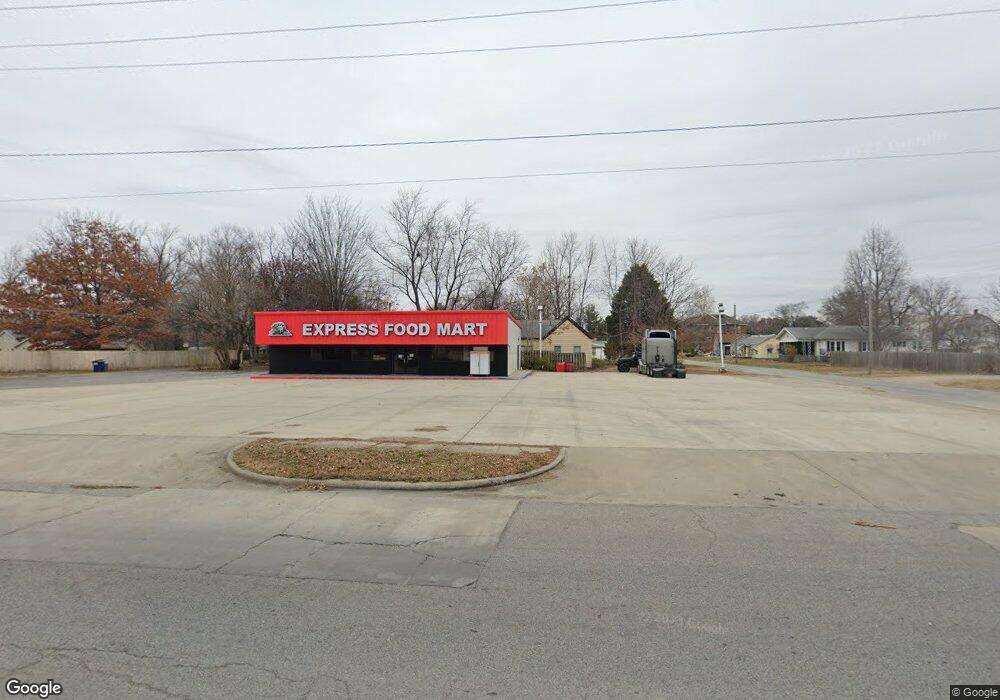
302 W Main St Du Quoin, IL 62832
--
Bed
--
Bath
--
Sq Ft
0.37
Acres
About This Home
This home is located at 302 W Main St, Du Quoin, IL 62832. 302 W Main St is a home located in Perry County with nearby schools including DuQuoin High School, DuQuoin Elementary School, and DuQuoin Middle School.
Ownership History
Date
Name
Owned For
Owner Type
Purchase Details
Closed on
Apr 22, 2020
Sold by
Hart Murphy C
Bought by
Niya & Rahi Inc
Purchase Details
Closed on
Jan 7, 2016
Sold by
Perry County
Bought by
Attorneys Land Trust #1
Purchase Details
Closed on
Jan 2, 2016
Sold by
Tri Star Petroleum Llc
Bought by
Perry Country and Trust #2-61-1300-070
Purchase Details
Closed on
Feb 28, 2007
Sold by
Du Quoin Food Mart Llc
Bought by
Tri Star Petroleum Llc
Home Financials for this Owner
Home Financials are based on the most recent Mortgage that was taken out on this home.
Original Mortgage
$300,000
Interest Rate
6.27%
Mortgage Type
Future Advance Clause Open End Mortgage
Purchase Details
Closed on
Dec 13, 2005
Sold by
Sks Venturs Llc
Bought by
Du Quoin Food Mart Llc
Home Financials for this Owner
Home Financials are based on the most recent Mortgage that was taken out on this home.
Original Mortgage
$459,637
Interest Rate
6.36%
Mortgage Type
Future Advance Clause Open End Mortgage
Create a Home Valuation Report for This Property
The Home Valuation Report is an in-depth analysis detailing your home's value as well as a comparison with similar homes in the area
Home Values in the Area
Average Home Value in this Area
Purchase History
| Date | Buyer | Sale Price | Title Company |
|---|---|---|---|
| Niya & Rahi Inc | $25,000 | None Available | |
| Attorneys Land Trust #1 | -- | Attorney | |
| Perry Country | -- | Attorney | |
| Tri Star Petroleum Llc | $300,000 | None Available | |
| Du Quoin Food Mart Llc | $450,000 | None Available |
Source: Public Records
Mortgage History
| Date | Status | Borrower | Loan Amount |
|---|---|---|---|
| Previous Owner | Tri Star Petroleum Llc | $300,000 | |
| Previous Owner | Du Quoin Food Mart Llc | $459,637 |
Source: Public Records
Tax History Compared to Growth
Tax History
| Year | Tax Paid | Tax Assessment Tax Assessment Total Assessment is a certain percentage of the fair market value that is determined by local assessors to be the total taxable value of land and additions on the property. | Land | Improvement |
|---|---|---|---|---|
| 2023 | $3,792 | $46,907 | $6,290 | $40,617 |
| 2022 | $4,775 | $51,827 | $5,737 | $46,090 |
| 2021 | $4,783 | $48,609 | $5,381 | $43,228 |
| 2020 | $941 | $9,750 | $4,979 | $4,771 |
| 2019 | $3,396 | $34,996 | $4,834 | $30,162 |
| 2018 | $3,397 | $34,996 | $4,834 | $30,162 |
| 2017 | $3,430 | $35,122 | $4,851 | $30,271 |
| 2016 | -- | $0 | $0 | $0 |
| 2015 | -- | $0 | $0 | $0 |
| 2013 | $3,371 | $33,701 | $4,655 | $29,046 |
Source: Public Records
Map
Nearby Homes
- 419 W Main St
- 507 W Main St
- 115 S Hickory St
- 209 W Franklin St
- 13 N Division St
- 107 N Division St
- 6 S Division St
- 12 N Division St
- 209 S Walnut St
- 311 E South St
- 501 S Washington St
- 213 S Peach St
- 402 E Keyes St
- 418 E Keyes St
- 535 E Main St
- 540 E Main St
- 734 N Division St
- 544 E Main St
- 9 S Illinois Ave
- 508 Hidden Lakes Dr