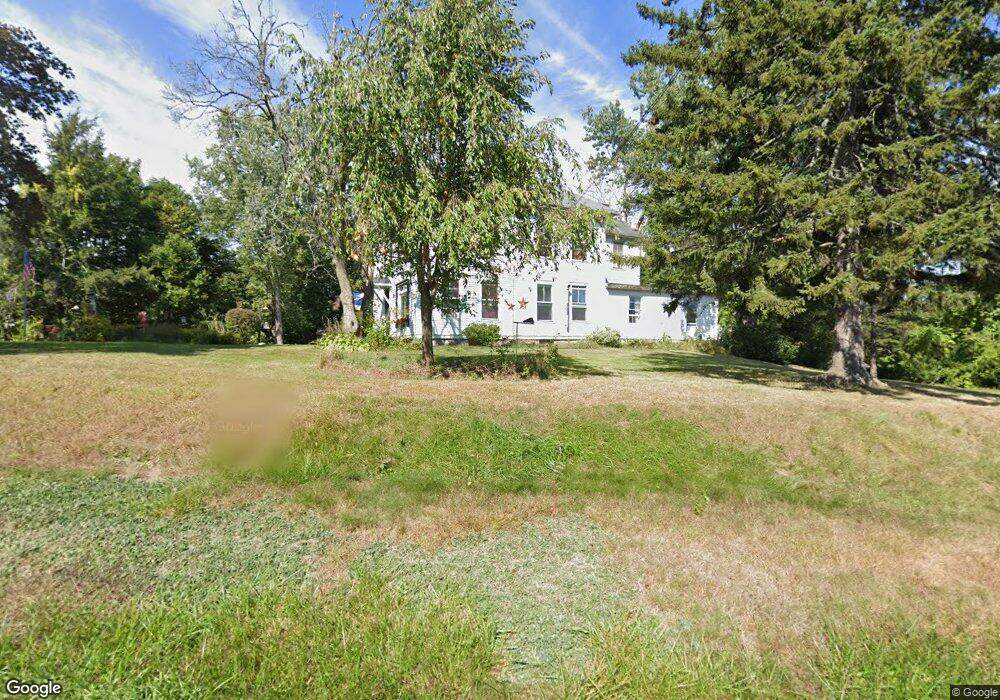
302 W Main St Millbury, MA 01527
Estimated Value: $511,000 - $549,000
6
Beds
2
Baths
2,440
Sq Ft
$220/Sq Ft
Est. Value
About This Home
This home is located at 302 W Main St, Millbury, MA 01527 and is currently estimated at $535,605, approximately $219 per square foot. 302 W Main St is a home located in Worcester County with nearby schools including Elmwood Street Elementary School, Raymond E. Shaw Elementary School, and Millbury Junior/Senior High School.
Ownership History
Date
Name
Owned For
Owner Type
Purchase Details
Closed on
Oct 29, 2021
Sold by
Provencher Joseph P and Provencher Kim P
Bought by
Rocheford Neil J and Rocheford Kim P
Current Estimated Value
Purchase Details
Closed on
Mar 24, 2006
Sold by
Fitton Patricia A and Putnam Patricia A
Bought by
Provencher Joseph P and Provencher Kim P
Home Financials for this Owner
Home Financials are based on the most recent Mortgage that was taken out on this home.
Original Mortgage
$100,000
Interest Rate
6.28%
Mortgage Type
Purchase Money Mortgage
Create a Home Valuation Report for This Property
The Home Valuation Report is an in-depth analysis detailing your home's value as well as a comparison with similar homes in the area
Home Values in the Area
Average Home Value in this Area
Purchase History
| Date | Buyer | Sale Price | Title Company |
|---|---|---|---|
| Rocheford Neil J | -- | None Available | |
| Provencher Joseph P | $80,000 | -- |
Source: Public Records
Mortgage History
| Date | Status | Borrower | Loan Amount |
|---|---|---|---|
| Previous Owner | Provencher Joseph P | $100,000 |
Source: Public Records
Tax History Compared to Growth
Tax History
| Year | Tax Paid | Tax Assessment Tax Assessment Total Assessment is a certain percentage of the fair market value that is determined by local assessors to be the total taxable value of land and additions on the property. | Land | Improvement |
|---|---|---|---|---|
| 2025 | $6,007 | $448,600 | $124,000 | $324,600 |
| 2024 | $5,279 | $399,000 | $114,700 | $284,300 |
| 2023 | $5,040 | $348,800 | $80,200 | $268,600 |
| 2022 | $4,571 | $304,700 | $80,200 | $224,500 |
| 2021 | $4,361 | $282,600 | $80,200 | $202,400 |
| 2020 | $4,271 | $278,600 | $80,200 | $198,400 |
| 2019 | $3,982 | $251,200 | $72,900 | $178,300 |
| 2018 | $3,712 | $227,200 | $72,900 | $154,300 |
| 2017 | $3,810 | $231,900 | $72,900 | $159,000 |
| 2016 | $3,527 | $214,300 | $72,900 | $141,400 |
| 2015 | $3,447 | $209,400 | $77,600 | $131,800 |
| 2014 | $3,283 | $192,000 | $77,600 | $114,400 |
Source: Public Records
Map
Nearby Homes