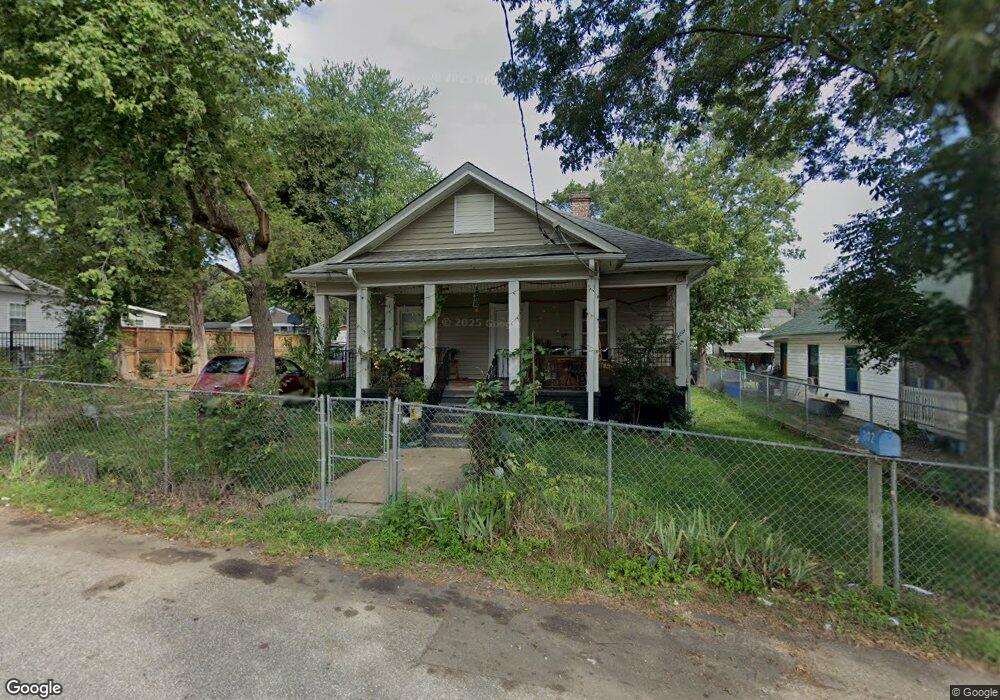
302 W Morgan St Greenville, SC 29611
City View NeighborhoodEstimated Value: $133,000 - $200,000
3
Beds
1
Bath
1,364
Sq Ft
$123/Sq Ft
Est. Value
About This Home
This home is located at 302 W Morgan St, Greenville, SC 29611 and is currently estimated at $167,440, approximately $122 per square foot. 302 W Morgan St is a home located in Greenville County with nearby schools including Alexander Elementary School, Lakeview Middle, and Greenville Senior High School.
Ownership History
Date
Name
Owned For
Owner Type
Purchase Details
Closed on
May 28, 2019
Sold by
Hoxhallari Nazmije and Zani Nazmije
Bought by
Zani Daniel
Current Estimated Value
Purchase Details
Closed on
Jul 31, 2009
Sold by
Mandala Dimitra
Bought by
Zani Nazmije
Purchase Details
Closed on
Feb 22, 2008
Sold by
First Fsla
Bought by
Mandala Dimitra
Home Financials for this Owner
Home Financials are based on the most recent Mortgage that was taken out on this home.
Original Mortgage
$13,000
Interest Rate
5.65%
Mortgage Type
Purchase Money Mortgage
Purchase Details
Closed on
Nov 17, 2000
Sold by
Lworth Fred W
Bought by
On Kevin J
Purchase Details
Closed on
Jan 28, 2000
Sold by
Rimer Arvin S
Bought by
Dilworth Fred
Purchase Details
Closed on
Sep 21, 1998
Sold by
Rimer Arvan S
Bought by
Yearwood Jerry B
Create a Home Valuation Report for This Property
The Home Valuation Report is an in-depth analysis detailing your home's value as well as a comparison with similar homes in the area
Home Values in the Area
Average Home Value in this Area
Purchase History
| Date | Buyer | Sale Price | Title Company |
|---|---|---|---|
| Zani Daniel | -- | None Available | |
| Hoxhallari Nazmije | -- | None Available | |
| Zani Nazmije | -- | -- | |
| Mandala Dimitra | $13,000 | Attorney | |
| On Kevin J | -- | -- | |
| Dilworth Fred | $21,000 | -- | |
| Yearwood Jerry B | $29,500 | -- |
Source: Public Records
Mortgage History
| Date | Status | Borrower | Loan Amount |
|---|---|---|---|
| Previous Owner | Mandala Dimitra | $13,000 |
Source: Public Records
Tax History Compared to Growth
Tax History
| Year | Tax Paid | Tax Assessment Tax Assessment Total Assessment is a certain percentage of the fair market value that is determined by local assessors to be the total taxable value of land and additions on the property. | Land | Improvement |
|---|---|---|---|---|
| 2024 | $1,484 | $3,150 | $1,260 | $1,890 |
| 2023 | $1,484 | $3,150 | $1,260 | $1,890 |
| 2022 | $1,436 | $3,150 | $1,260 | $1,890 |
| 2021 | $1,542 | $3,150 | $1,260 | $1,890 |
| 2020 | $1,616 | $3,150 | $1,260 | $1,890 |
| 2019 | $1,348 | $2,520 | $720 | $1,800 |
| 2018 | $1,226 | $2,520 | $720 | $1,800 |
| 2017 | $1,213 | $2,520 | $720 | $1,800 |
| 2016 | $1,163 | $41,920 | $12,000 | $29,920 |
| 2015 | $1,163 | $41,920 | $12,000 | $29,920 |
| 2014 | $673 | $47,200 | $15,000 | $32,200 |
Source: Public Records
Map
Nearby Homes