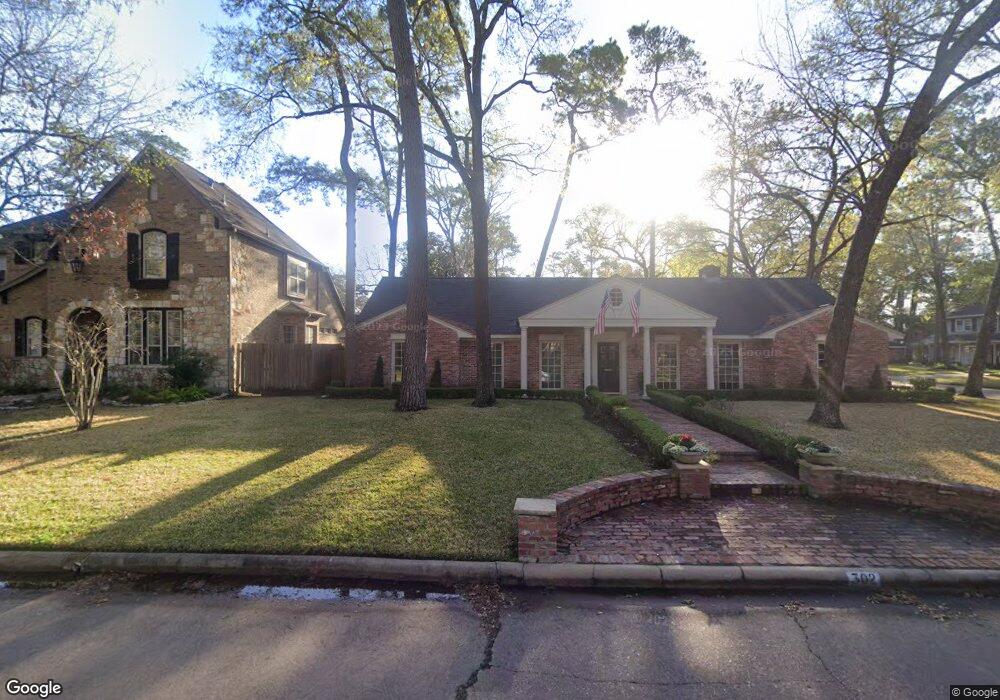
302 Wilchester Blvd Houston, TX 77079
Memorial NeighborhoodEstimated Value: $1,159,000 - $1,588,000
4
Beds
3
Baths
2,556
Sq Ft
$500/Sq Ft
Est. Value
About This Home
This home is located at 302 Wilchester Blvd, Houston, TX 77079 and is currently estimated at $1,277,349, approximately $499 per square foot. 302 Wilchester Blvd is a home located in Harris County with nearby schools including Rummel Creek Elementary School, Memorial Middle, and Stratford High School.
Ownership History
Date
Name
Owned For
Owner Type
Purchase Details
Closed on
Oct 1, 2009
Sold by
The Metropolitan Group Inc
Bought by
Pfeil Richard Glen and Pfeil Karen Nolan
Current Estimated Value
Home Financials for this Owner
Home Financials are based on the most recent Mortgage that was taken out on this home.
Original Mortgage
$335,625
Outstanding Balance
$219,605
Interest Rate
5.12%
Mortgage Type
New Conventional
Estimated Equity
$1,057,744
Purchase Details
Closed on
Jun 13, 2008
Sold by
Sloan Mark Randall and Sloan Monica Ann
Bought by
The Metropolitan Group Inc
Home Financials for this Owner
Home Financials are based on the most recent Mortgage that was taken out on this home.
Original Mortgage
$295,000
Interest Rate
7%
Mortgage Type
Purchase Money Mortgage
Purchase Details
Closed on
Aug 1, 1998
Sold by
Sloan Laurie Marshall
Bought by
Sloan Laurie Marshall and The Laurie Marshall Sloan Trust
Create a Home Valuation Report for This Property
The Home Valuation Report is an in-depth analysis detailing your home's value as well as a comparison with similar homes in the area
Home Values in the Area
Average Home Value in this Area
Purchase History
| Date | Buyer | Sale Price | Title Company |
|---|---|---|---|
| Pfeil Richard Glen | -- | Multiple | |
| The Metropolitan Group Inc | -- | None Available | |
| Sloan Laurie Marshall | -- | -- |
Source: Public Records
Mortgage History
| Date | Status | Borrower | Loan Amount |
|---|---|---|---|
| Open | Pfeil Richard Glen | $335,625 | |
| Previous Owner | The Metropolitan Group Inc | $295,000 |
Source: Public Records
Tax History Compared to Growth
Tax History
| Year | Tax Paid | Tax Assessment Tax Assessment Total Assessment is a certain percentage of the fair market value that is determined by local assessors to be the total taxable value of land and additions on the property. | Land | Improvement |
|---|---|---|---|---|
| 2025 | $18,399 | $1,115,433 | $646,850 | $468,583 |
| 2024 | $18,399 | $1,080,000 | $646,850 | $433,150 |
| 2023 | $18,399 | $1,120,047 | $646,850 | $473,197 |
| 2022 | $23,677 | $1,012,732 | $551,725 | $461,007 |
| 2021 | $23,456 | $980,000 | $523,188 | $456,812 |
| 2020 | $21,884 | $1,017,318 | $523,188 | $494,130 |
| 2019 | $20,787 | $794,000 | $513,675 | $280,325 |
| 2018 | $7,772 | $794,000 | $513,675 | $280,325 |
| 2017 | $21,531 | $823,000 | $570,750 | $252,250 |
| 2016 | $22,472 | $859,000 | $570,750 | $288,250 |
| 2015 | $14,617 | $828,000 | $570,750 | $257,250 |
| 2014 | $14,617 | $770,000 | $428,063 | $341,937 |
Source: Public Records
Map
Nearby Homes
- 127 Gershwin Dr
- 327 Electra Dr
- 414 E Gaywood Dr
- 334 Wycliffe Dr
- 12910 Traviata Dr
- 303 Isolde Dr
- 12806 Boheme Dr
- 12903 Tosca Ln
- 12815 Traviata Dr
- 12810 Figaro Dr
- 203 Cove Creek Ln
- 0 Verdi Dr Unit 93271393
- 210 Big Hollow Ln
- 12803 Hansel Ln
- 10726 Riverview Dr
- 12707 Boheme Dr Unit 1304
- 12707 Boheme Dr Unit 1401
- 12707 Boheme Dr Unit 506
- 12707 Boheme Dr
- 10703 Deerwood Rd
- 306 Wilchester Blvd
- 303 Cinnamon Oak Ln
- 307 Cinnamon Oak Ln
- 310 Wilchester Blvd
- 13027 Boheme Dr
- 13023 Boheme Dr
- 303 Wilchester Blvd
- 311 Cinnamon Oak Ln
- 307 Wilchester Blvd
- 13019 Boheme Dr
- 13035 Boheme Dr
- 314 Wilchester Blvd
- 311 Wilchester Blvd
- 315 Cinnamon Oak Ln
- 13015 Boheme Dr
- 13039 Boheme Dr
- 302 Cinnamon Oak Ln
- 13026 Hermitage Ln
- 315 Wilchester Blvd
- 13022 Hermitage Ln