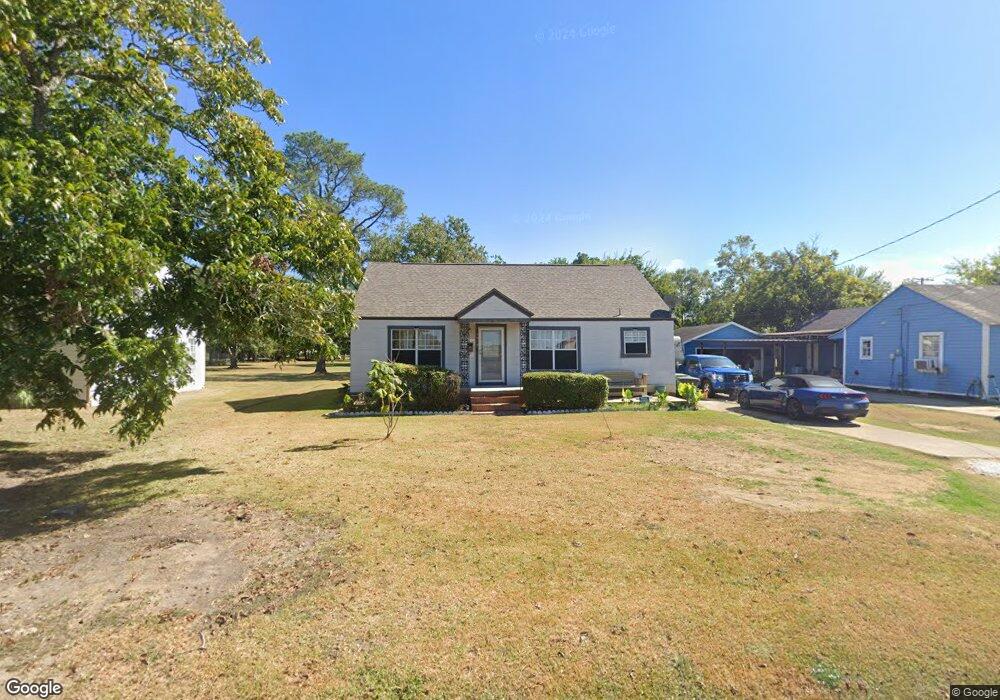
3020 36th St Port Arthur, TX 77642
Estimated Value: $132,000 - $156,000
--
Bed
--
Bath
1,520
Sq Ft
$94/Sq Ft
Est. Value
About This Home
This home is located at 3020 36th St, Port Arthur, TX 77642 and is currently estimated at $142,714, approximately $93 per square foot. 3020 36th St is a home located in Jefferson County with nearby schools including Houston Elementary School, Abraham Lincoln Middle School, and Memorial High School.
Ownership History
Date
Name
Owned For
Owner Type
Purchase Details
Closed on
Aug 3, 2023
Sold by
Derouen Mary Glorioso Scully
Bought by
Glorioso Christa
Current Estimated Value
Purchase Details
Closed on
Jul 25, 2023
Sold by
Glorioso Royal Judy
Bought by
Glorioso Christa
Purchase Details
Closed on
Jul 13, 2023
Sold by
Welch Shelly Glorioso
Bought by
Glorioso Christa
Purchase Details
Closed on
Jul 12, 2023
Sold by
Perello Carmen Glorioso
Bought by
Glorioso Christa
Create a Home Valuation Report for This Property
The Home Valuation Report is an in-depth analysis detailing your home's value as well as a comparison with similar homes in the area
Home Values in the Area
Average Home Value in this Area
Purchase History
| Date | Buyer | Sale Price | Title Company |
|---|---|---|---|
| Glorioso Christa | -- | None Listed On Document | |
| Glorioso Christa | -- | None Listed On Document | |
| Glorioso Christa | -- | None Listed On Document | |
| Glorioso Christa | -- | None Listed On Document |
Source: Public Records
Tax History Compared to Growth
Tax History
| Year | Tax Paid | Tax Assessment Tax Assessment Total Assessment is a certain percentage of the fair market value that is determined by local assessors to be the total taxable value of land and additions on the property. | Land | Improvement |
|---|---|---|---|---|
| 2025 | -- | $84,450 | -- | -- |
| 2024 | -- | $76,773 | -- | -- |
| 2023 | $2,039 | $69,794 | $0 | $0 |
| 2022 | $2,015 | $63,449 | $0 | $0 |
| 2021 | $1,912 | $65,474 | $5,400 | $60,074 |
| 2020 | $0 | $57,068 | $5,400 | $51,668 |
| 2019 | $1,519 | $47,670 | $5,400 | $42,270 |
| 2018 | $0 | $47,670 | $5,400 | $42,270 |
| 2017 | $0 | $47,670 | $5,400 | $42,270 |
| 2016 | $1,396 | $47,670 | $5,400 | $42,270 |
| 2015 | -- | $47,670 | $5,400 | $42,270 |
| 2014 | -- | $47,670 | $5,400 | $42,270 |
Source: Public Records
Map
Nearby Homes