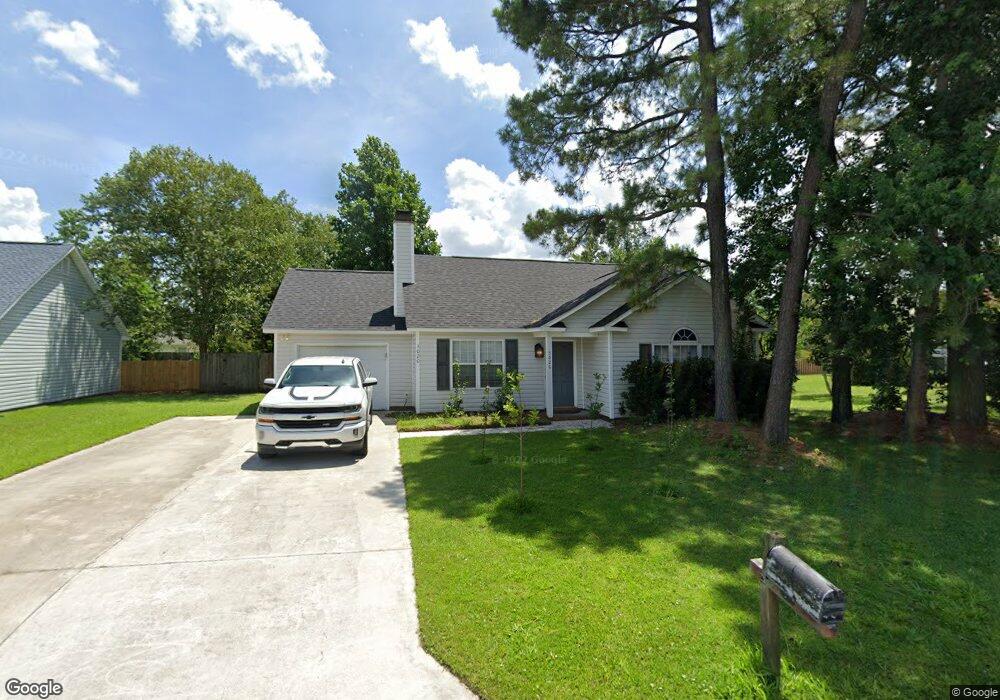
3020 Answorth Ct Wilmington, NC 28405
Estimated Value: $326,428 - $373,000
3
Beds
2
Baths
1,310
Sq Ft
$268/Sq Ft
Est. Value
About This Home
This home is located at 3020 Answorth Ct, Wilmington, NC 28405 and is currently estimated at $350,857, approximately $267 per square foot. 3020 Answorth Ct is a home located in New Hanover County with nearby schools including Castle Hayne Elementary School, Emma B. Trask Middle School, and Emsley A. Laney High School.
Ownership History
Date
Name
Owned For
Owner Type
Purchase Details
Closed on
Apr 25, 2018
Sold by
Saenz Hector Oswaldo
Bought by
Williams Erik T and Lenthin Priscilla
Current Estimated Value
Home Financials for this Owner
Home Financials are based on the most recent Mortgage that was taken out on this home.
Original Mortgage
$185,185
Outstanding Balance
$160,385
Interest Rate
4.75%
Mortgage Type
FHA
Estimated Equity
$190,472
Purchase Details
Closed on
Feb 20, 2001
Sold by
Bryson Harold C
Bought by
Saenz Hector O Paulina A
Purchase Details
Closed on
Sep 26, 1997
Sold by
Bill Clark Homes Of Wilmington
Bought by
Bryson Harold C
Purchase Details
Closed on
Nov 13, 1996
Sold by
Ammons Land Company Inc
Bought by
Bill Clark Homes Of Wilmington
Purchase Details
Closed on
Jul 20, 1994
Sold by
Ammons Northchase Corp
Bought by
Ammons Land Company Inc
Create a Home Valuation Report for This Property
The Home Valuation Report is an in-depth analysis detailing your home's value as well as a comparison with similar homes in the area
Home Values in the Area
Average Home Value in this Area
Purchase History
| Date | Buyer | Sale Price | Title Company |
|---|---|---|---|
| Williams Erik T | $198,000 | None Available | |
| Saenz Hector O Paulina A | $118,500 | -- | |
| Bryson Harold C | $117,000 | -- | |
| Bill Clark Homes Of Wilmington | $15,000 | -- | |
| Ammons Land Company Inc | $1,028,000 | -- |
Source: Public Records
Mortgage History
| Date | Status | Borrower | Loan Amount |
|---|---|---|---|
| Open | Williams Erik T | $185,185 |
Source: Public Records
Tax History Compared to Growth
Tax History
| Year | Tax Paid | Tax Assessment Tax Assessment Total Assessment is a certain percentage of the fair market value that is determined by local assessors to be the total taxable value of land and additions on the property. | Land | Improvement |
|---|---|---|---|---|
| 2025 | $1,167 | $336,800 | $114,400 | $222,400 |
| 2023 | $1,167 | $213,700 | $63,200 | $150,500 |
| 2022 | $1,174 | $213,700 | $63,200 | $150,500 |
| 2021 | $1,178 | $213,700 | $63,200 | $150,500 |
| 2020 | $1,050 | $166,000 | $42,000 | $124,000 |
| 2019 | $1,050 | $166,000 | $42,000 | $124,000 |
| 2018 | $1,050 | $166,000 | $42,000 | $124,000 |
| 2017 | $1,075 | $166,000 | $42,000 | $124,000 |
| 2016 | $1,078 | $155,600 | $42,000 | $113,600 |
| 2015 | $1,002 | $155,600 | $42,000 | $113,600 |
| 2014 | $985 | $155,600 | $42,000 | $113,600 |
Source: Public Records
Map
Nearby Homes
- 3206 Belmont Cir
- 3212 Belmont Cir
- 4409 Woodcroft Ct
- 3201 Ashbourne Ct
- 3208 Ashborne Ct
- 5707 Mossberg Ct
- 3308 Belmont Cir
- 4319 Lakemoor Dr
- 4424 Bridgeport Dr
- 2801 Hobart Dr
- 2805 Colonel Lamb Dr
- 4300 Pennhurst Ct
- 4814 Exton Park Loop
- 1174 Saint Augustine Dr
- 4574 Parsons Mill Dr
- 5004 Exton Park Loop
- 4612 Parsons Mill Dr
- 4628 Parsons Mill Dr
- 4457 Parsons Mill Dr
- 4474 Parsons Mill Dr
- 3020 Answorth Dr
- 3024 Answorth Dr
- 3024 Answorth Ct
- 4101 Brinkman Dr
- 4105 Brinkman Dr
- 3105 Cabot Dr
- 3109 Cabot Dr
- 3019 Answorth Ct
- 3028 Answorth Ct
- 3015 Answorth Ct
- 3101 Cabot Dr
- 3032 Answorth Dr
- 3032 Answorth Dr
- 3117 Cabot Dr
- 4100 Brinkman Dr
- 4104 Brinkman Dr
- 4021 Brinkman Dr
- 3108 Cabot Dr
- 4032 Brinkman Dr
- 4016 Claymore Dr