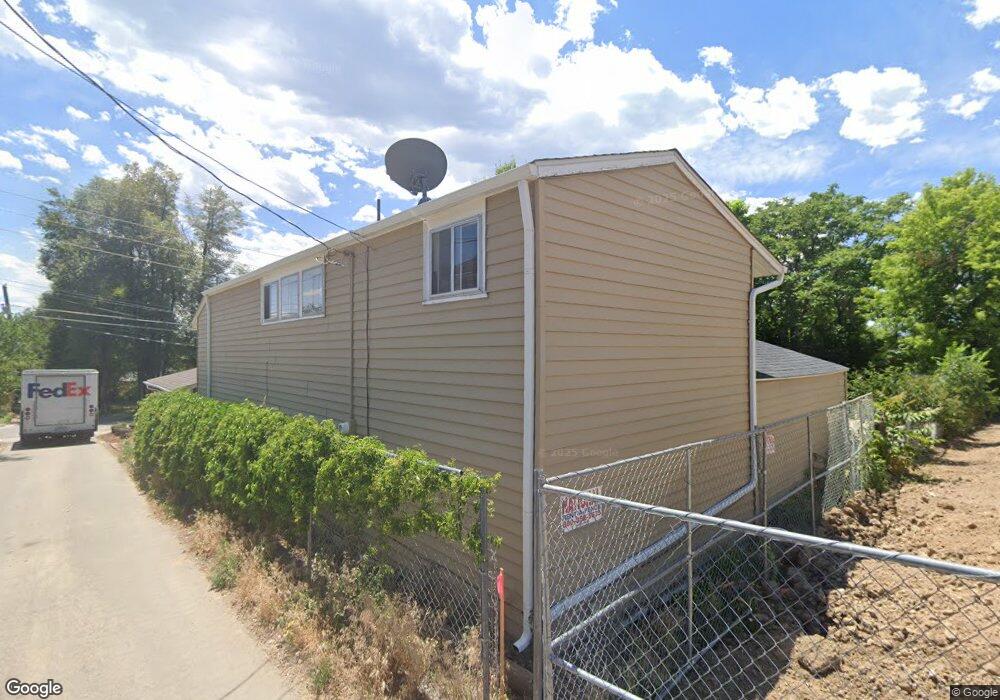
3020 Fenton St Wheat Ridge, CO 80214
East Wheat Ridge NeighborhoodEstimated Value: $554,000 - $728,000
2
Beds
3
Baths
1,791
Sq Ft
$350/Sq Ft
Est. Value
About This Home
This home is located at 3020 Fenton St, Wheat Ridge, CO 80214 and is currently estimated at $626,113, approximately $349 per square foot. 3020 Fenton St is a home located in Jefferson County with nearby schools including Lumberg Elementary School, Rocky Mountain Prep - Berkeley, and Midtown Montessori Academy @ Sloan's Lake.
Ownership History
Date
Name
Owned For
Owner Type
Purchase Details
Closed on
Apr 17, 2020
Sold by
Woodman Thomas G and Woodman Delisa F
Bought by
Woodman Thomas G and Woodman Delisa F
Current Estimated Value
Purchase Details
Closed on
Dec 16, 2002
Sold by
Mcdermott Michael M and Mcdermott Delisa F
Bought by
Mcdermott Delisa F
Purchase Details
Closed on
Nov 10, 2000
Sold by
Heather Hyde
Bought by
Mcdermott Michael M and Mcdermott Delisa F
Home Financials for this Owner
Home Financials are based on the most recent Mortgage that was taken out on this home.
Original Mortgage
$177,710
Outstanding Balance
$65,389
Interest Rate
7.86%
Mortgage Type
FHA
Estimated Equity
$560,724
Purchase Details
Closed on
May 17, 1999
Sold by
Dumais George A and Dumais Diane H
Bought by
Hyde Heather
Home Financials for this Owner
Home Financials are based on the most recent Mortgage that was taken out on this home.
Original Mortgage
$108,000
Interest Rate
6.94%
Create a Home Valuation Report for This Property
The Home Valuation Report is an in-depth analysis detailing your home's value as well as a comparison with similar homes in the area
Home Values in the Area
Average Home Value in this Area
Purchase History
| Date | Buyer | Sale Price | Title Company |
|---|---|---|---|
| Woodman Thomas G | -- | None Available | |
| Mcdermott Delisa F | -- | -- | |
| Mcdermott Michael M | $193,000 | -- | |
| Hyde Heather | $135,000 | -- |
Source: Public Records
Mortgage History
| Date | Status | Borrower | Loan Amount |
|---|---|---|---|
| Open | Mcdermott Michael M | $177,710 | |
| Previous Owner | Hyde Heather | $108,000 |
Source: Public Records
Tax History Compared to Growth
Tax History
| Year | Tax Paid | Tax Assessment Tax Assessment Total Assessment is a certain percentage of the fair market value that is determined by local assessors to be the total taxable value of land and additions on the property. | Land | Improvement |
|---|---|---|---|---|
| 2024 | $3,107 | $35,540 | $18,883 | $16,657 |
| 2023 | $3,107 | $35,540 | $18,883 | $16,657 |
| 2022 | $2,673 | $30,022 | $15,346 | $14,676 |
| 2021 | $2,710 | $30,886 | $15,788 | $15,098 |
| 2020 | $2,528 | $28,962 | $15,541 | $13,421 |
| 2019 | $2,494 | $28,962 | $15,541 | $13,421 |
| 2018 | $2,256 | $25,322 | $7,697 | $17,625 |
| 2017 | $2,038 | $25,322 | $7,697 | $17,625 |
| 2016 | $1,866 | $21,697 | $5,276 | $16,421 |
| 2015 | $1,717 | $21,697 | $5,276 | $16,421 |
| 2014 | $1,717 | $18,730 | $4,872 | $13,858 |
Source: Public Records
Map
Nearby Homes
- 3022 Fenton St
- 3019 Chase St
- 6000 W 29th Ave
- 2933 Benton St
- 2890 N Harlan St Unit 102
- 3100 Ames St
- 2834 Benton St
- 3280 Ames St
- 3530 Fenton St
- 3450 Benton St
- 3515 Gray St
- 5125 W 29th Ave Unit 1
- 2590 Gray St
- 2598 Harlan St Unit 1
- 2577 Depew St
- 2777 Kendall St
- 2568 Eaton St
- 3530 Chase St
- 6500 W 32nd Ave
- 3342 Marshall St