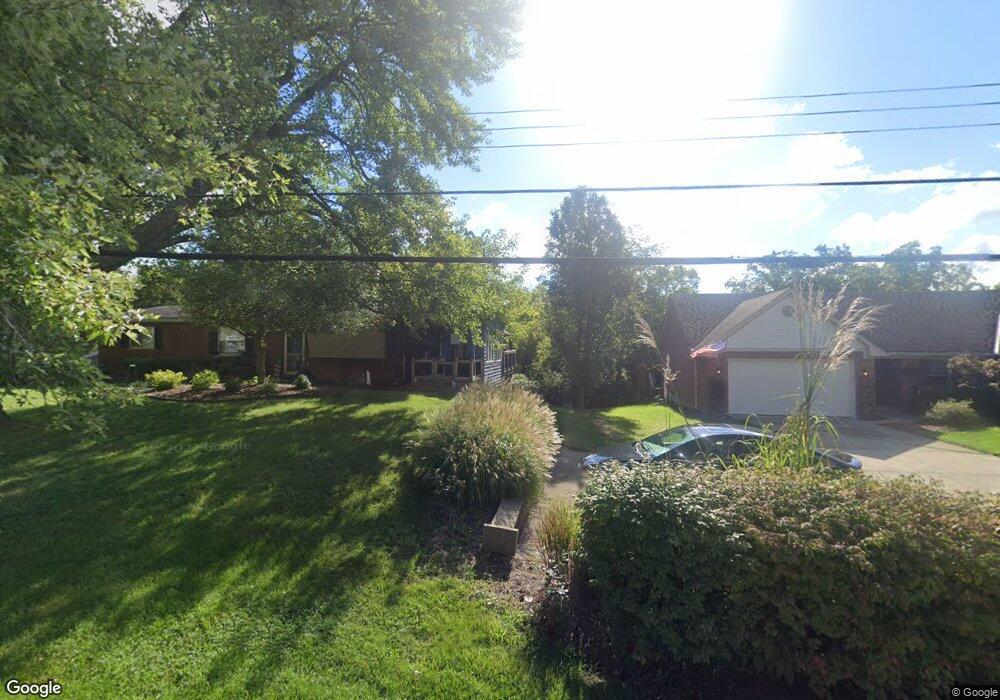
3020 Fiddlers Green Rd Cincinnati, OH 45248
Estimated Value: $379,295 - $422,000
3
Beds
2
Baths
1,678
Sq Ft
$242/Sq Ft
Est. Value
About This Home
This home is located at 3020 Fiddlers Green Rd, Cincinnati, OH 45248 and is currently estimated at $406,074, approximately $241 per square foot. 3020 Fiddlers Green Rd is a home located in Hamilton County with nearby schools including Charles T. Young Elementary School, Taylor Middle School, and Taylor High School.
Ownership History
Date
Name
Owned For
Owner Type
Purchase Details
Closed on
Oct 19, 2010
Sold by
Stallkamp Michael R
Bought by
Stallkamp Michael R and Stallkamp Judith R
Current Estimated Value
Home Financials for this Owner
Home Financials are based on the most recent Mortgage that was taken out on this home.
Original Mortgage
$195,650
Outstanding Balance
$127,854
Interest Rate
4.16%
Mortgage Type
New Conventional
Estimated Equity
$278,220
Purchase Details
Closed on
Oct 31, 2005
Sold by
Heidel Mark J and Heidel Jenny L
Bought by
Stallkamp Michael R
Home Financials for this Owner
Home Financials are based on the most recent Mortgage that was taken out on this home.
Original Mortgage
$205,700
Interest Rate
5.89%
Mortgage Type
Fannie Mae Freddie Mac
Purchase Details
Closed on
Jul 8, 2004
Sold by
Kennedy Anne M
Bought by
Heidel Mark J and Heidel Jenny L
Create a Home Valuation Report for This Property
The Home Valuation Report is an in-depth analysis detailing your home's value as well as a comparison with similar homes in the area
Home Values in the Area
Average Home Value in this Area
Purchase History
| Date | Buyer | Sale Price | Title Company |
|---|---|---|---|
| Stallkamp Michael R | -- | Attorney | |
| Stallkamp Michael R | $242,000 | None Available | |
| Heidel Mark J | $39,000 | -- |
Source: Public Records
Mortgage History
| Date | Status | Borrower | Loan Amount |
|---|---|---|---|
| Open | Stallkamp Michael R | $195,650 | |
| Closed | Stallkamp Michael R | $205,700 |
Source: Public Records
Tax History Compared to Growth
Tax History
| Year | Tax Paid | Tax Assessment Tax Assessment Total Assessment is a certain percentage of the fair market value that is determined by local assessors to be the total taxable value of land and additions on the property. | Land | Improvement |
|---|---|---|---|---|
| 2024 | $5,077 | $108,987 | $20,279 | $88,708 |
| 2023 | $5,085 | $108,987 | $20,279 | $88,708 |
| 2022 | $4,321 | $72,457 | $20,034 | $52,423 |
| 2021 | $4,202 | $72,457 | $20,034 | $52,423 |
| 2020 | $4,245 | $72,457 | $20,034 | $52,423 |
| 2019 | $3,886 | $61,405 | $16,979 | $44,426 |
| 2018 | $3,735 | $61,405 | $16,979 | $44,426 |
| 2017 | $3,504 | $61,405 | $16,979 | $44,426 |
| 2016 | $4,378 | $79,101 | $18,533 | $60,568 |
| 2015 | $4,425 | $79,101 | $18,533 | $60,568 |
| 2014 | $4,859 | $85,968 | $18,533 | $67,435 |
| 2013 | $4,488 | $81,099 | $17,483 | $63,616 |
Source: Public Records
Map
Nearby Homes
- 7674 Briargreen Ln
- 2794 Buckridge Dr
- 7368 Pickway Dr
- Ivy Plan at Reserve at Deer Run - Designer Collection
- Olive Plan at Reserve at Deer Run - Designer Collection
- Magnolia Plan at Reserve at Deer Run - Designer Collection
- Clay Plan at Reserve at Deer Run - Masterpiece Collection
- Beckett Plan at Reserve at Deer Run - Masterpiece Collection
- Morgan Plan at Reserve at Deer Run - Designer Collection
- Huxley Plan at Reserve at Deer Run - Masterpiece Collection
- Pearson Plan at Reserve at Deer Run - Masterpiece Collection
- Winslow Plan at Reserve at Deer Run - Masterpiece Collection
- Teagan Plan at Reserve at Deer Run - Masterpiece Collection
- Willow Plan at Reserve at Deer Run - Designer Collection
- Amelia Plan at Reserve at Deer Run - Designer Collection
- Hazel Plan at Reserve at Deer Run - Designer Collection
- Mitchell Plan at Reserve at Deer Run - Masterpiece Collection
- Edenton Plan at Reserve at Deer Run - Designer Collection
- Linden Plan at Reserve at Deer Run - Designer Collection
- Birch Plan at Reserve at Deer Run - Designer Collection
- 3028 Fiddlers Green Rd
- 3012 Fiddlers Green Rd
- 3006 Fiddlers Green Rd
- 3036 Fiddlers Green Rd
- 7481 Fiddlers Trail Dr
- 3023 Fiddlers Green Rd
- 3015 Fiddlers Green Rd
- 3033 Fiddlers Green Rd
- 3046 Fiddlers Green Rd
- 3000 Fiddlers Green Rd
- 3009 Fiddlers Green Rd
- 7477 Fiddlers Trail Dr
- 3039 Fiddlers Green Rd
- 3003 Fiddlers Green Rd
- 3041 Fiddlers Ridge Dr
- 3037 Fiddlers Ridge Dr
- 3068 Fiddlers Green Rd
- 7473 Fiddlers Trail Dr
- 3033 Fiddlers Ridge Dr
- 3045 Fiddlers Ridge Dr