Estimated Value: $189,000 - $201,000
4
Beds
2
Baths
1,664
Sq Ft
$117/Sq Ft
Est. Value
About This Home
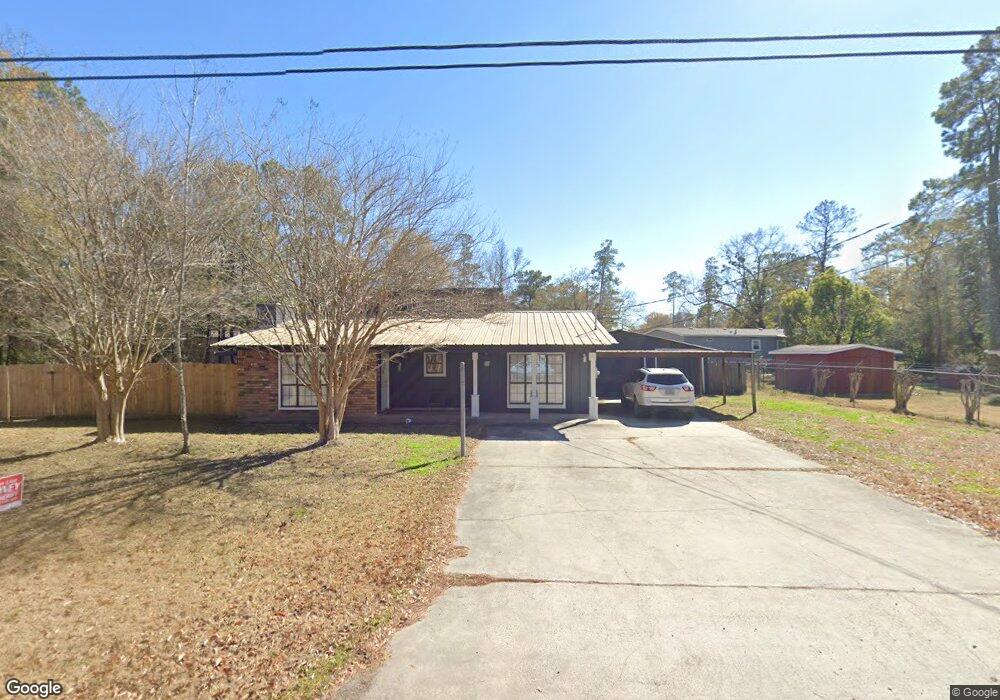
This home is located at 3020 Stanley Dr Unit 3030 Stanley Drive, Vidor, TX 77662 and is currently estimated at $195,270, approximately $117 per square foot. 3020 Stanley Dr Unit 3030 Stanley Drive is a home located in Orange County with nearby schools including Faith Christian Academy.
Ownership History
Date
Name
Owned For
Owner Type
Purchase Details
Closed on
Mar 11, 2022
Sold by
Garrett Kristy
Bought by
Ragan Gary R
Current Estimated Value
Home Financials for this Owner
Home Financials are based on the most recent Mortgage that was taken out on this home.
Original Mortgage
$42,500
Outstanding Balance
$26,018
Interest Rate
3.85%
Mortgage Type
Seller Take Back
Estimated Equity
$169,252
Purchase Details
Closed on
Dec 10, 2018
Sold by
Stubblefield Garry W and Stubblefield Jackie A
Bought by
Garrett Kristy
Purchase Details
Closed on
Dec 19, 2011
Sold by
Wells Fargo Bank Na
Bought by
Stubblefield Garry and Stubblefield Jackie
Purchase Details
Closed on
Apr 5, 2011
Sold by
Horton Glen E
Bought by
Garrett Steven
Purchase Details
Closed on
Jun 16, 2006
Sold by
Horton Glen E and Horton Paula
Bought by
Wells Fargo Bank Na
Create a Home Valuation Report for This Property
The Home Valuation Report is an in-depth analysis detailing your home's value as well as a comparison with similar homes in the area
Home Values in the Area
Average Home Value in this Area
Purchase History
| Date | Buyer | Sale Price | Title Company |
|---|---|---|---|
| Ragan Gary R | -- | Price Rodney | |
| Garrett Kristy | -- | None Available | |
| Stubblefield Garry | -- | Lsi Title Agency Inc | |
| Garrett Steven | -- | -- | |
| Garrett Steven | -- | -- | |
| Wells Fargo Bank Na | $81,112 | None Available |
Source: Public Records
Mortgage History
| Date | Status | Borrower | Loan Amount |
|---|---|---|---|
| Open | Ragan Gary R | $42,500 |
Source: Public Records
Tax History Compared to Growth
Tax History
| Year | Tax Paid | Tax Assessment Tax Assessment Total Assessment is a certain percentage of the fair market value that is determined by local assessors to be the total taxable value of land and additions on the property. | Land | Improvement |
|---|---|---|---|---|
| 2025 | $2,659 | $107,485 | $12,303 | $95,182 |
| 2024 | $2,229 | $102,546 | $7,364 | $95,182 |
| 2023 | $2,629 | $103,891 | $4,450 | $99,441 |
| 2022 | $1,560 | $82,780 | $4,450 | $78,330 |
| 2021 | $4,262 | $142,747 | $4,450 | $150,950 |
| 2020 | $1,716 | $56,500 | $4,450 | $52,050 |
| 2019 | $3,981 | $129,770 | $4,450 | $125,320 |
| 2018 | $3,702 | $123,660 | $4,450 | $119,210 |
| 2017 | $1,462 | $123,660 | $4,450 | $119,210 |
| 2016 | $3,472 | $114,830 | $4,450 | $110,380 |
| 2015 | $1,413 | $108,831 | $4,450 | $104,381 |
| 2014 | $1,413 | $104,997 | $4,450 | $100,547 |
Source: Public Records
Map
Nearby Homes
- 2890 Evangeline Dr
- 2950 Old Highway 90 E
- 120 Lawrence Ln
- 220 Delores St
- 835 Strickland St
- 425 Lawrence Ln
- 250 Oakland Dr
- tbd Oakland St
- 305 Oakland Dr
- 0 Fm 1132 Unit 93970706
- 2665 Lincoln St
- 3665 E Railroad St
- 0 School Rd
- 605 N Lakeside St
- 18046 Interstate 10
- 000 Hwy 1132
- 2950 Highway 90
- 16595 Interstate 10
- 18185 Ih 10
- 970 S Mayhaw Dr
- 3020 Stanley Dr
- 3010 Stanley Dr
- 3015 Flora St
- 3015 Stanley Dr
- 3245 Evangeline Dr
- 3150 Stanley Dr
- 3157 Stanley Dr
- 3020 Zoann St
- 3120 Flora St
- 3255 Evangeline Dr
- 3225 Stanley Dr
- 3035 Zoann St
- 450 Edna Ln
- 3010 Evangeline Dr
- 3240 Evangeline Dr
- 3015 Zoann St
- 3250 Evangeline Dr
- 3250 Evangeline Dr Unit Next to 3250 Evangel
- 3280 Zoann St
- 3125 Zoann St