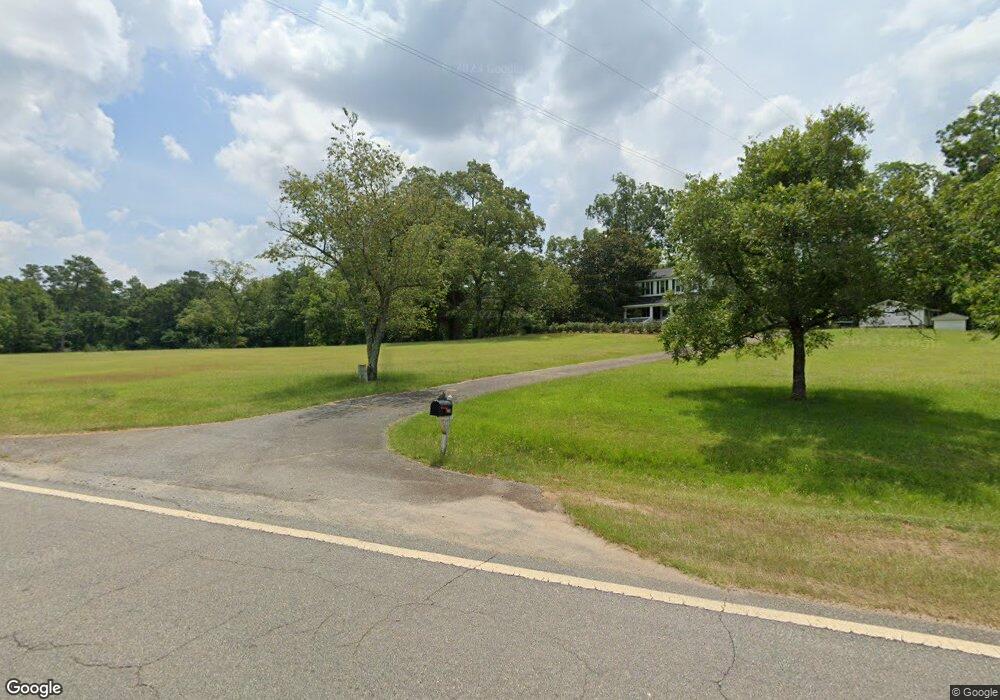
3021 Johnstonville Rd Forsyth, GA 31029
Estimated Value: $689,000 - $775,297
--
Bed
2
Baths
3,294
Sq Ft
$224/Sq Ft
Est. Value
About This Home
This home is located at 3021 Johnstonville Rd, Forsyth, GA 31029 and is currently estimated at $737,432, approximately $223 per square foot. 3021 Johnstonville Rd is a home located in Monroe County with nearby schools including Samuel E. Hubbard Elementary School and Mary Persons High School.
Ownership History
Date
Name
Owned For
Owner Type
Purchase Details
Closed on
Dec 7, 2022
Sold by
Snow Cathy H
Bought by
Snow Charles Michael and Snow Courtney Coston
Current Estimated Value
Purchase Details
Closed on
Sep 7, 2021
Sold by
Snow Charles Michael
Bought by
Snow Cathy H
Purchase Details
Closed on
Dec 28, 2018
Sold by
Snow Cathy
Bought by
Snow Amy
Purchase Details
Closed on
Dec 11, 2018
Sold by
Dumas Patricia
Bought by
Snow Cathy
Purchase Details
Closed on
Nov 11, 2018
Sold by
Dumas Patricia
Bought by
Snow Amy
Purchase Details
Closed on
Jan 2, 2009
Sold by
Snow Charles Michael
Bought by
Johnson Randall Thomas
Purchase Details
Closed on
Oct 6, 1994
Sold by
Snow Parker
Bought by
Snow Charlotte
Purchase Details
Closed on
Jan 12, 1987
Sold by
Snow H P Est
Bought by
Snow H Parker
Purchase Details
Closed on
Nov 5, 1940
Sold by
Ottauquechee Savings Bank Of The County
Bought by
Snow H P
Create a Home Valuation Report for This Property
The Home Valuation Report is an in-depth analysis detailing your home's value as well as a comparison with similar homes in the area
Home Values in the Area
Average Home Value in this Area
Purchase History
| Date | Buyer | Sale Price | Title Company |
|---|---|---|---|
| Snow Charles Michael | -- | -- | |
| Snow Cathy H | -- | -- | |
| Snow Amy | -- | -- | |
| Snow Cathy | -- | -- | |
| Snow Cathy H | -- | -- | |
| Snow Amy | -- | -- | |
| Johnson Randall Thomas | -- | -- | |
| Snow Charlotte | -- | -- | |
| Snow H Parker | -- | -- | |
| Snow H P | -- | -- |
Source: Public Records
Tax History Compared to Growth
Tax History
| Year | Tax Paid | Tax Assessment Tax Assessment Total Assessment is a certain percentage of the fair market value that is determined by local assessors to be the total taxable value of land and additions on the property. | Land | Improvement |
|---|---|---|---|---|
| 2024 | $27,637 | $250,872 | $122,320 | $128,552 |
| 2023 | $6,808 | $241,272 | $122,320 | $118,952 |
| 2022 | $6,673 | $246,472 | $127,520 | $118,952 |
| 2021 | $6,908 | $246,472 | $127,520 | $118,952 |
| 2020 | $7,082 | $246,472 | $127,520 | $118,952 |
| 2019 | $7,138 | $246,472 | $127,520 | $118,952 |
| 2018 | $7,165 | $246,672 | $127,720 | $118,952 |
| 2017 | $7,170 | $246,672 | $127,720 | $118,952 |
| 2016 | $5,932 | $246,672 | $127,720 | $118,952 |
| 2015 | $5,623 | $246,672 | $127,720 | $118,952 |
| 2014 | $3,913 | $186,952 | $127,720 | $59,232 |
Source: Public Records
Map
Nearby Homes
- 107 River Forest Dr
- 202 Equestrian Dr
- 111 River Forest Dr
- 102 Gardens
- 701 River Overlook
- 115 Forest Overlook Dr
- 111 Gardens Dr
- 116 Gardens Dr
- 105 Birch Cir
- 108 Gardens
- 1544 English Rd
- 112 Gardens
- 303 Freedom Dr
- 601 River Overlook
- 114 Gardens
- 518 River Overlook
- 351 Cherokee Trail
- 507 River Overlook
- 106 Forest Place
- 512 River Forest Dr
- 2963 Johnstonville Rd
- 2859 Johnstonville Rd
- 3083 Johnstonville Rd
- 0 Johnstonville Rd Unit LOT 5 3107177
- 0 Johnstonville Rd Unit 3160034
- 0 Johnstonville Rd Unit 3175471
- 0 Johnstonville Rd Unit LT D16 7131824
- 0 Johnstonville Rd Unit LT D11 7130810
- 0 Johnstonville Rd Unit LT D13 7131815
- 0 Johnstonville Rd Unit LT D15 7131823
- 0 Johnstonville Rd Unit LT D12 7131809
- 0 Johnstonville Rd Unit LT D14 7131820
- 0 Johnstonville Rd Unit LT D10 7130802
- 0 Johnstonville Rd Unit LOT D9 7130792
- 0 Johnstonville Rd Unit 44 & 45 7147649
- 0 Johnstonville Rd Unit 44 7529297
- 0 Johnstonville Rd Unit LOT 2 7552154
- 0 Johnstonville Rd Unit 45 8205682
- 0 Johnstonville Rd Unit 10466797
- 0 Johnstonville Rd Unit 175871