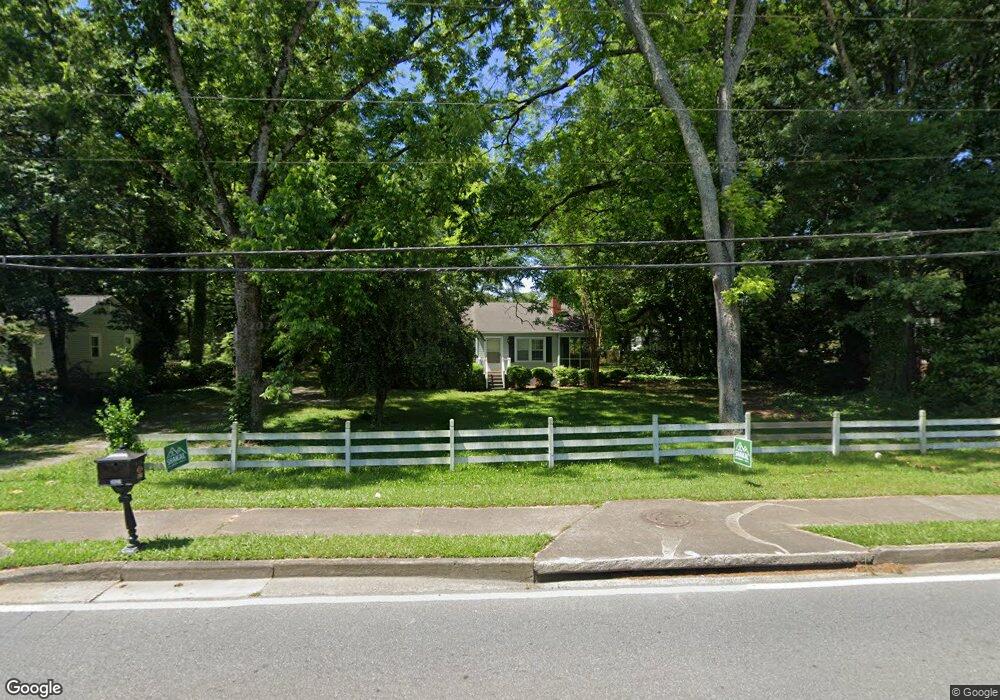
3021 N Main St NW Kennesaw, GA 30144
Estimated Value: $229,000 - $328,000
3
Beds
1
Bath
943
Sq Ft
$287/Sq Ft
Est. Value
About This Home
This home is located at 3021 N Main St NW, Kennesaw, GA 30144 and is currently estimated at $270,374, approximately $286 per square foot. 3021 N Main St NW is a home located in Cobb County with nearby schools including Kennesaw Elementary School, Big Shanty Elementary School, and Awtrey Middle School.
Ownership History
Date
Name
Owned For
Owner Type
Purchase Details
Closed on
Jul 14, 2003
Sold by
Counts Gurdon W
Bought by
Counts Gurdon W and Counts Andrea
Current Estimated Value
Home Financials for this Owner
Home Financials are based on the most recent Mortgage that was taken out on this home.
Original Mortgage
$122,400
Outstanding Balance
$51,355
Interest Rate
5.2%
Mortgage Type
New Conventional
Estimated Equity
$219,019
Purchase Details
Closed on
Apr 25, 2002
Sold by
Heck Gary D and Heck Judith A
Bought by
Counts Gurdon W
Home Financials for this Owner
Home Financials are based on the most recent Mortgage that was taken out on this home.
Original Mortgage
$118,000
Interest Rate
6.98%
Purchase Details
Closed on
Jul 16, 2001
Sold by
Carmean Gary S and Carmean Carla J
Bought by
Heck Gary D and Heck Judith A
Create a Home Valuation Report for This Property
The Home Valuation Report is an in-depth analysis detailing your home's value as well as a comparison with similar homes in the area
Home Values in the Area
Average Home Value in this Area
Purchase History
| Date | Buyer | Sale Price | Title Company |
|---|---|---|---|
| Counts Gurdon W | -- | -- | |
| Counts Gurdon W | $128,000 | -- | |
| Heck Gary D | $80,000 | -- |
Source: Public Records
Mortgage History
| Date | Status | Borrower | Loan Amount |
|---|---|---|---|
| Open | Counts Gurdon W | $122,400 | |
| Previous Owner | Counts Gurdon W | $118,000 |
Source: Public Records
Tax History Compared to Growth
Tax History
| Year | Tax Paid | Tax Assessment Tax Assessment Total Assessment is a certain percentage of the fair market value that is determined by local assessors to be the total taxable value of land and additions on the property. | Land | Improvement |
|---|---|---|---|---|
| 2025 | $2,546 | $84,504 | $46,540 | $37,964 |
| 2024 | $2,245 | $74,456 | $39,380 | $35,076 |
| 2023 | $1,818 | $60,284 | $32,220 | $28,064 |
| 2022 | $1,352 | $44,532 | $16,468 | $28,064 |
| 2021 | $1,216 | $40,068 | $16,468 | $23,600 |
| 2020 | $1,205 | $39,708 | $16,108 | $23,600 |
| 2019 | $1,075 | $35,428 | $14,320 | $21,108 |
| 2018 | $1,075 | $35,428 | $14,320 | $21,108 |
| 2017 | $895 | $31,132 | $10,024 | $21,108 |
| 2016 | $895 | $31,132 | $10,024 | $21,108 |
| 2015 | $854 | $28,988 | $10,024 | $18,964 |
| 2014 | $861 | $28,988 | $0 | $0 |
Source: Public Records
Map
Nearby Homes
- 2984 Porsche Place NW
- 2776 Saint Charles Ln NW
- 1001 Hillsborough Chase NW
- 2517 Hedgeway Cir
- 2719 Hedgeway Cir
- 1015 Kennesaw Springs Dr NW
- 2349 Whispering Dr NW
- 2930 Dallas St NW
- 1070 Rackley Way NW
- 3057 Windover Ln
- 2104 Irvin Ct
- 2106 Irvin Ct
- 2106 Remy Ct
- 2105 Remy Ct
- 2627 Chase Ridge
- 0 Randolph Cir Unit 7534199
- 0 Randolph Cir Unit 10473529
- 3522 Daventry Ln NW
- 3031 N Main St NW
- 3015 N Main St NW
- 2986 Porsche Place NW
- 2984 Porsche Place NW Unit N/a
- 2984 Porsche Place NW
- 2982 Porsche Place NW
- 2996 Cori Ct NW
- 2988 Porsche Place NW
- 2994 Cori Ct NW
- 0 Old 41 Hwy NW Unit 7556479
- 0 Old 41 Hwy NW Unit 7572942
- 0 Old 41 Hwy NW Unit 3203969
- 0 Old 41 Hwy NW Unit 7045041
- 0 Old 41 Hwy NW Unit 3239967
- 0 Old 41 Hwy NW Unit 3083617
- 0 Old 41 Hwy NW Unit 3193499
- 0 Old 41 Hwy NW Unit 3192201
- 0 Old 41 Hwy NW Unit 3141717
- 0 Old 41 Hwy NW Unit 8682016
- 0 Old 41 Hwy NW Unit 7071335