Estimated Value: $973,000 - $1,501,000
4
Beds
5
Baths
3,905
Sq Ft
$321/Sq Ft
Est. Value
About This Home
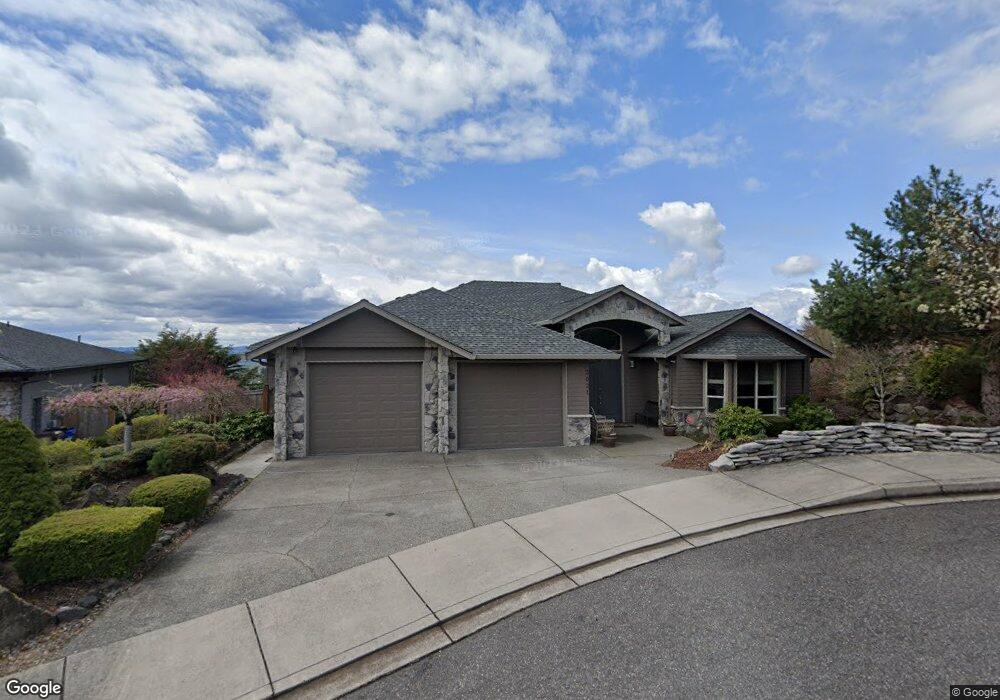
This home is located at 3021 NW 12th Ave, Camas, WA 98607 and is currently estimated at $1,254,012, approximately $321 per square foot. 3021 NW 12th Ave is a home located in Clark County with nearby schools including Dorothy Fox Elementary School, Skyridge Middle School, and Camas High School.
Ownership History
Date
Name
Owned For
Owner Type
Purchase Details
Closed on
Nov 9, 2021
Sold by
Briand Alain and Briand Lisa
Bought by
Briand Alain and Briand Lisa C
Current Estimated Value
Purchase Details
Closed on
Dec 22, 2009
Sold by
Henricus Bruce D
Bought by
Briand Alain and Briand Lisa
Home Financials for this Owner
Home Financials are based on the most recent Mortgage that was taken out on this home.
Original Mortgage
$417,000
Outstanding Balance
$270,311
Interest Rate
4.78%
Mortgage Type
New Conventional
Estimated Equity
$983,701
Purchase Details
Closed on
Nov 28, 2006
Sold by
Henricus Bruce D and Henricus Magdalena
Bought by
Henricus Bruce D and Jacobsen Magdalena
Purchase Details
Closed on
Aug 14, 2003
Sold by
Aspen Custom Homes Llp
Bought by
Henricus Bruce D and Henricus Magdalena
Create a Home Valuation Report for This Property
The Home Valuation Report is an in-depth analysis detailing your home's value as well as a comparison with similar homes in the area
Home Values in the Area
Average Home Value in this Area
Purchase History
| Date | Buyer | Sale Price | Title Company |
|---|---|---|---|
| Briand Alain | -- | None Available | |
| Briand Alain | $673,000 | Stewart Title | |
| Henricus Bruce D | -- | Clark County Title Co | |
| Henricus Bruce D | $150,000 | Clark County Title |
Source: Public Records
Mortgage History
| Date | Status | Borrower | Loan Amount |
|---|---|---|---|
| Open | Briand Alain | $417,000 |
Source: Public Records
Tax History Compared to Growth
Tax History
| Year | Tax Paid | Tax Assessment Tax Assessment Total Assessment is a certain percentage of the fair market value that is determined by local assessors to be the total taxable value of land and additions on the property. | Land | Improvement |
|---|---|---|---|---|
| 2025 | $10,506 | $1,133,457 | $245,000 | $888,457 |
| 2024 | $10,692 | $1,102,737 | $306,250 | $796,487 |
| 2023 | $10,119 | $1,206,927 | $323,750 | $883,177 |
| 2022 | $10,094 | $1,086,007 | $311,500 | $774,507 |
| 2021 | $9,834 | $905,475 | $267,750 | $637,725 |
| 2020 | $10,663 | $817,447 | $245,000 | $572,447 |
| 2019 | $10,525 | $821,940 | $245,000 | $576,940 |
| 2018 | $10,506 | $864,218 | $0 | $0 |
| 2017 | $9,257 | $725,041 | $0 | $0 |
| 2016 | $8,698 | $695,763 | $0 | $0 |
| 2015 | $8,575 | $650,524 | $0 | $0 |
| 2014 | -- | $604,651 | $0 | $0 |
| 2013 | -- | $525,062 | $0 | $0 |
Source: Public Records
Map
Nearby Homes
- 3003 NW 13th Ct
- 2925 NW 13th Ct
- 3345 NW 14th Ave
- 732 NW Garden Ct Unit Lot 27
- 682 NW Ct Unit Lot 26
- 736 NW Ilwaco St
- 590 NW Garden Ct Unit LOT 24
- 667 NW Halifax St Unit LOT 8
- 501 NW Halifax St Unit LOT 3
- 645 NW Garden Ct Unit LOT 20
- 0 Hood Street Lot 11
- 630 NW Halifax St Unit Lot 15
- 533 NW Halifax St
- 645 NW Halifax St Unit Lot 7
- 0 NW Garden Ct Unit 24028974
- 0 NW Halifax Unit Lot 6 24459237
- 813 NW Klickitat St
- 1672 NW Juneau Ct
- 3701 NW 9th Loop
- 3133 NW 18th Ave
- 3031 NW 12th Ave
- 3017 NW 12th Ave
- 3108 NW 9th Ave
- 3043 NW 12th Ave
- 3111 NW 9th Ave
- 3003 NW 12th Ave
- 3128 NW 9th Ave
- 3115 NW 9th Ave
- 2940 NW 12th Ave
- 3038 NW 12th Ave
- 2925 NW 12th Ave
- 3127 NW 9th Ave
- 3030 NW 12th Ave
- 1116 NW Goldendale St
- 3020 NW 12th Ave
- 1132 NW Goldendale St
- 0 NW 13th Ct Unit 1 23599883
- 0 NW 13th Ct Unit 2 23609017
- 3136 NW 9th Ave
- 3141 NW 9th Ave